EDULOG Design System
Making Edulog feel like one product
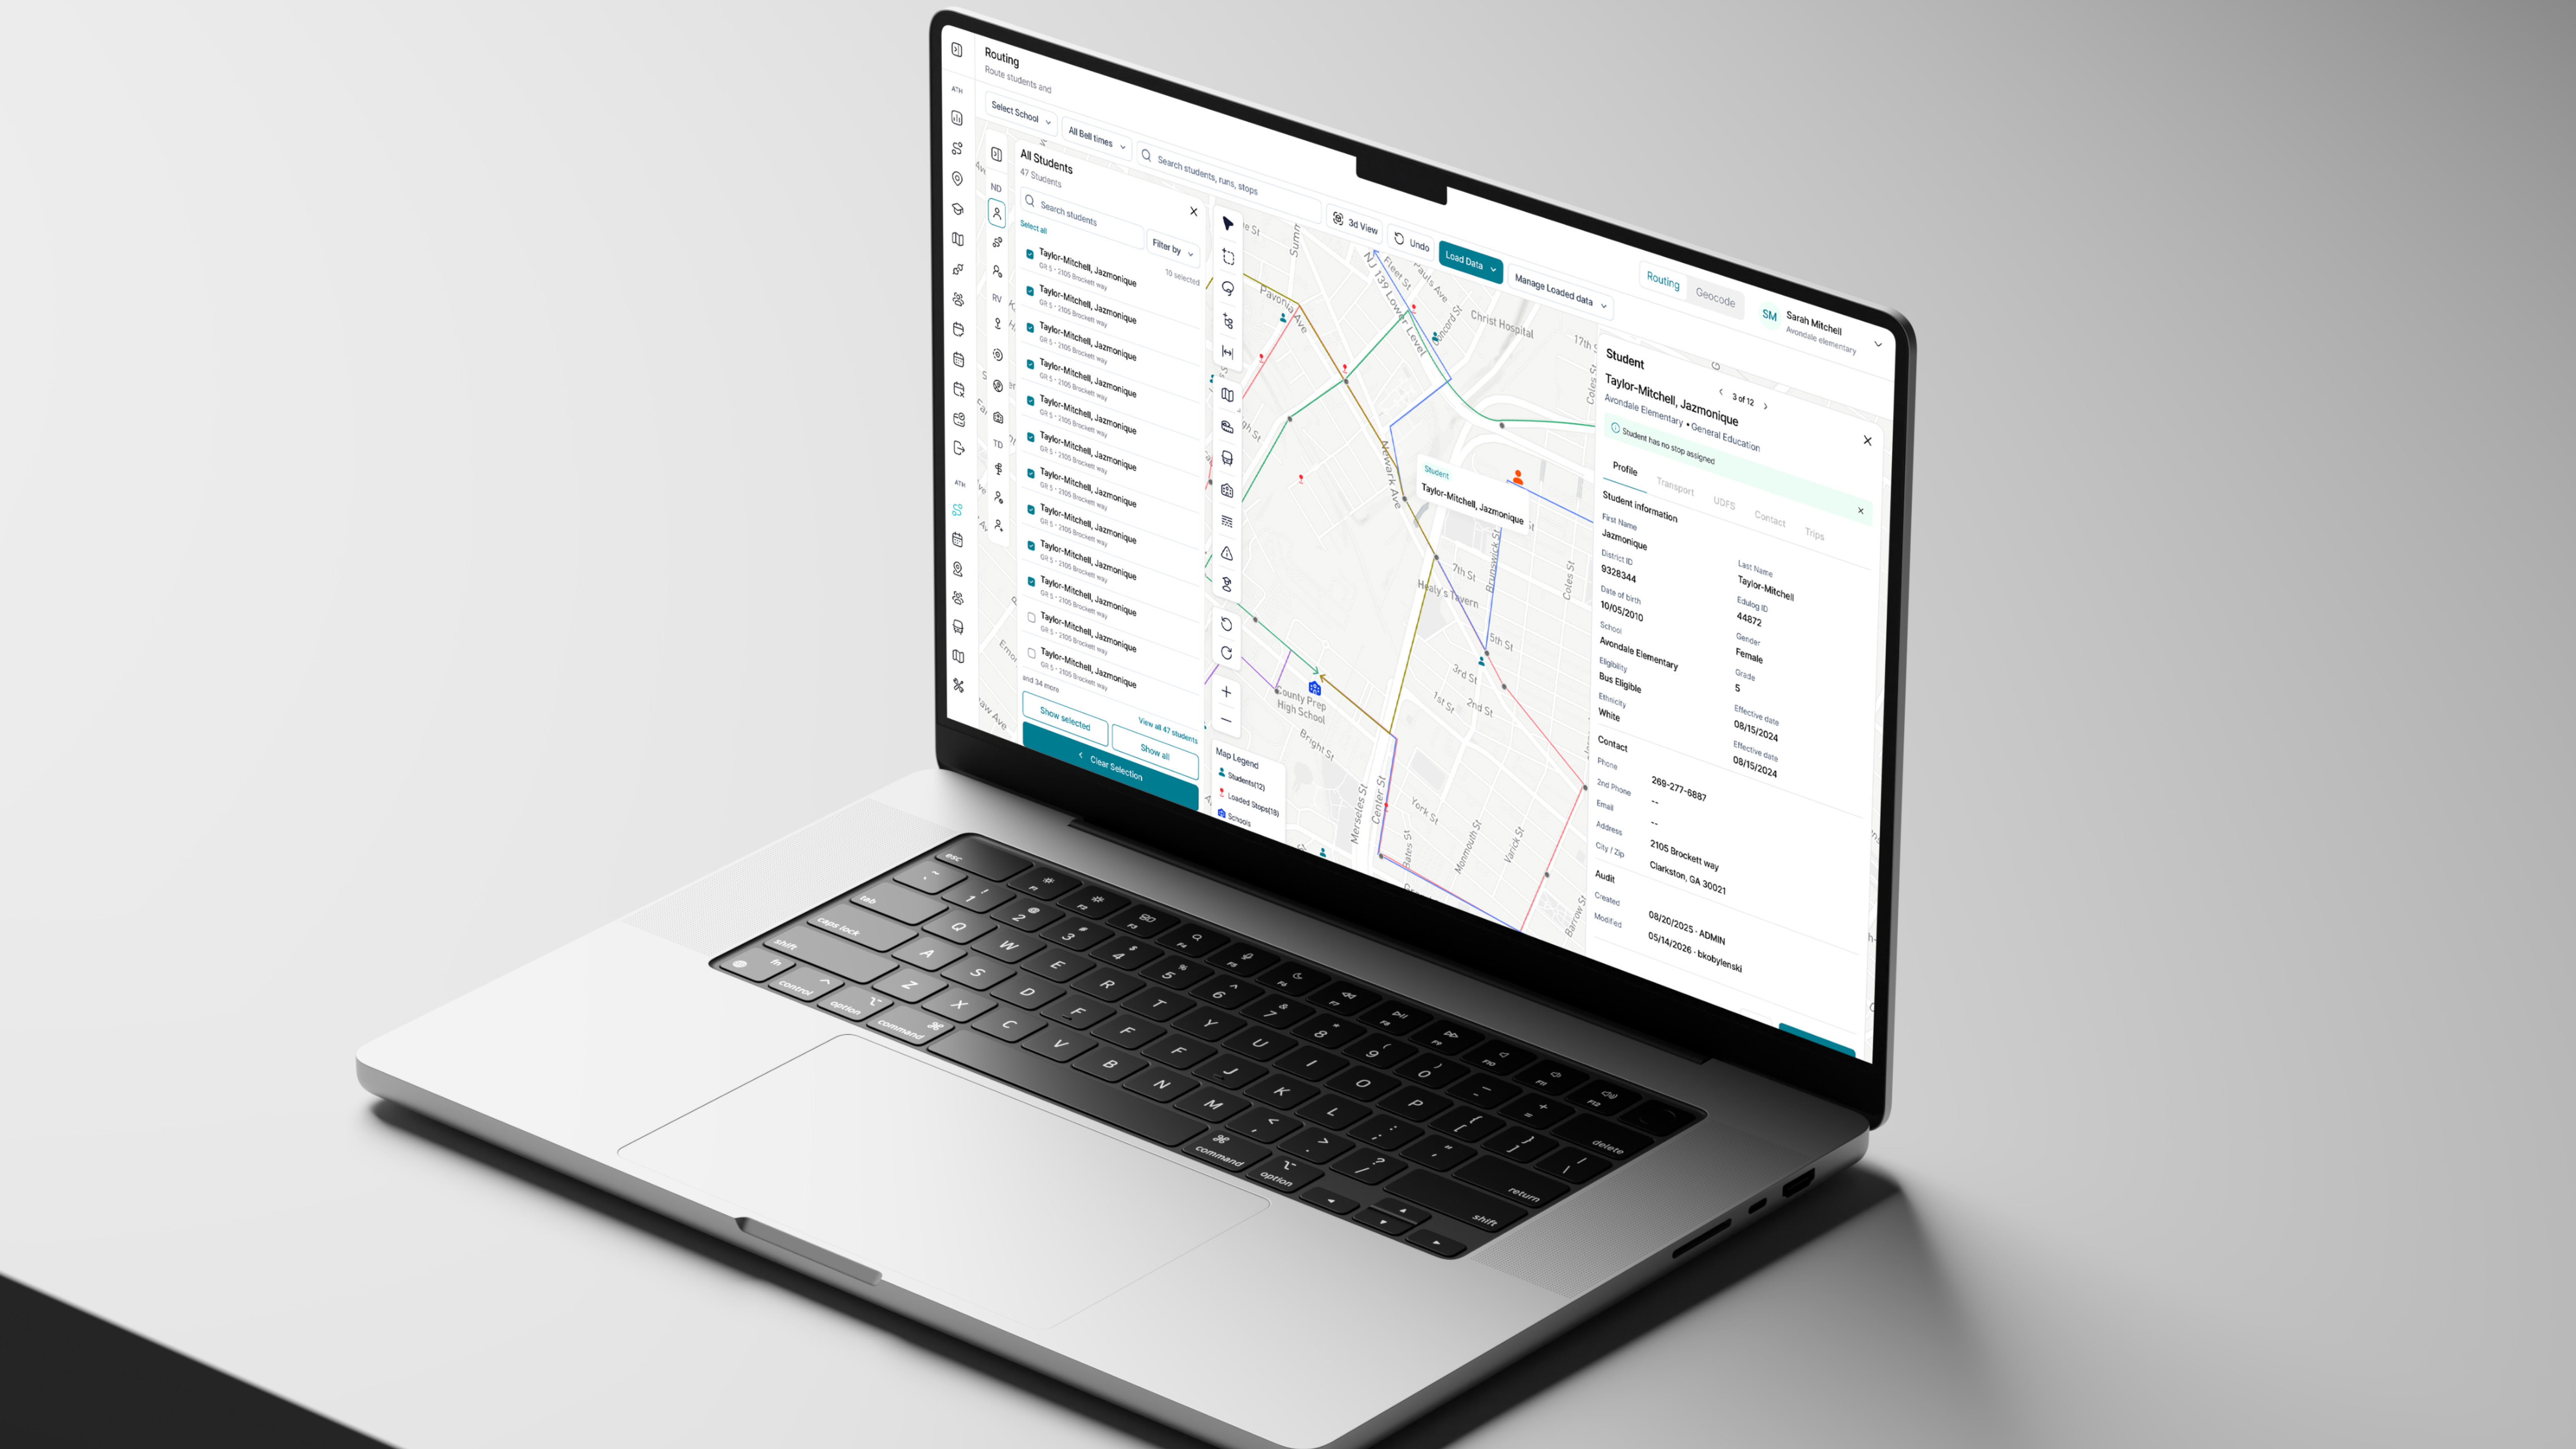
The Edulog design system is the shared foundation behind every tool in the platform: planning, places, operations, fleet, workforce and finance. It holds the type, icons, colour, space and layout decisions underneath the interface, the components built from them, and the patterns that decide how a list, a settings page or a long-running job behaves. I established those foundations, components and patterns, and the documentation the team designs from today.
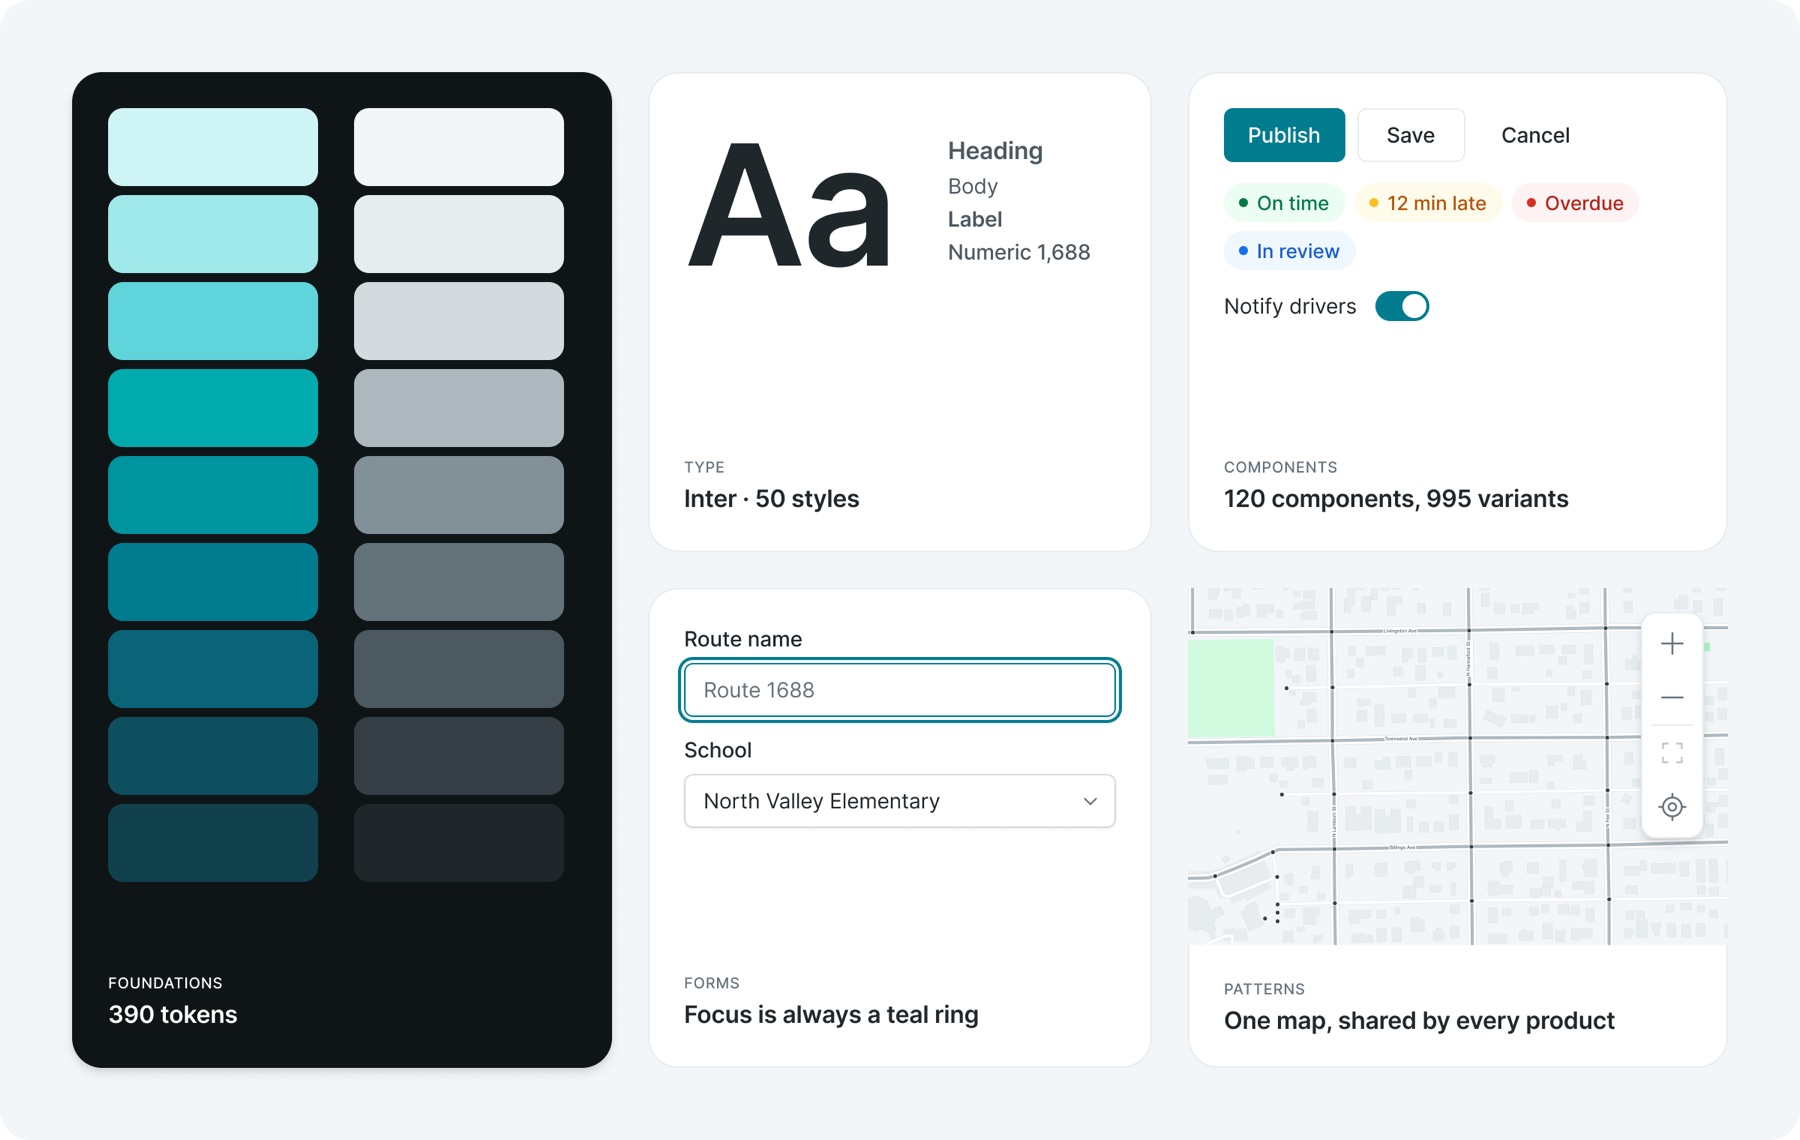
Overview
Edulog became one product before it looked like one.
Edulog's tools had come together in one platform, but the interface still reflected where each product came from. Navigation separated Athena from Athena Classic. Similar tasks used different patterns. Moving between modules meant encountering another set of conventions.
My role was to establish the shared structure and interaction rules that could make these tools feel connected, and give the team a consistent foundation for future features.
Navigation
Start with how people find their work
The navigation made the fragmentation visible. Its organisation depended on knowing the history of the products.
I reorganised it around areas of work: Planning, Places, Operations, Fleet, Workforce, Finance and System. Settings received its own navigation, creating room for configuration without adding another row of tabs to everyday screens.
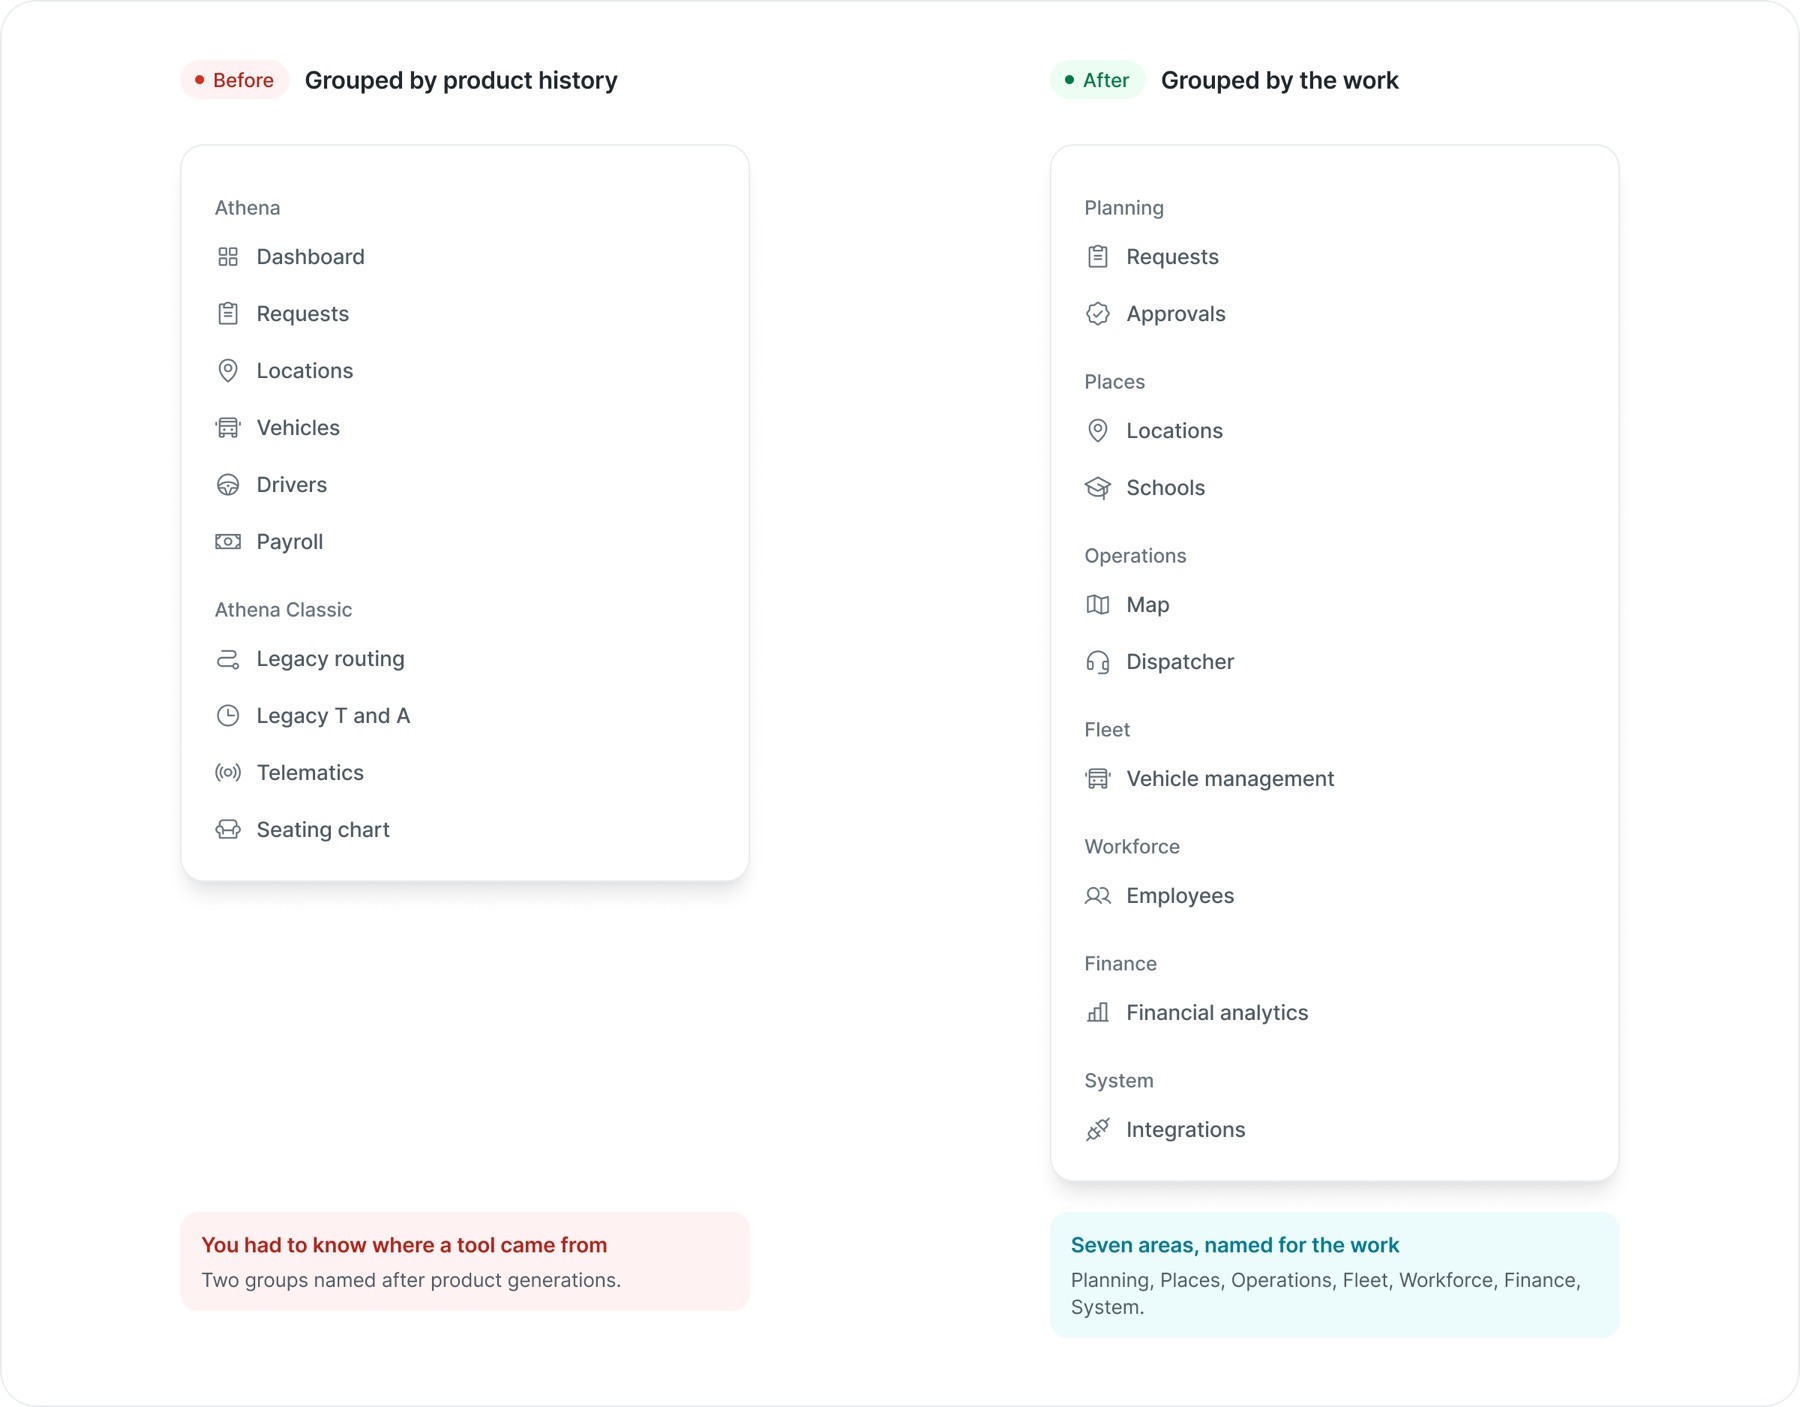
You had to know where a tool came from
Two groups named after product generations.
Seven areas, named for the work
Planning, Places, Operations, Fleet, Workforce, Finance, System.
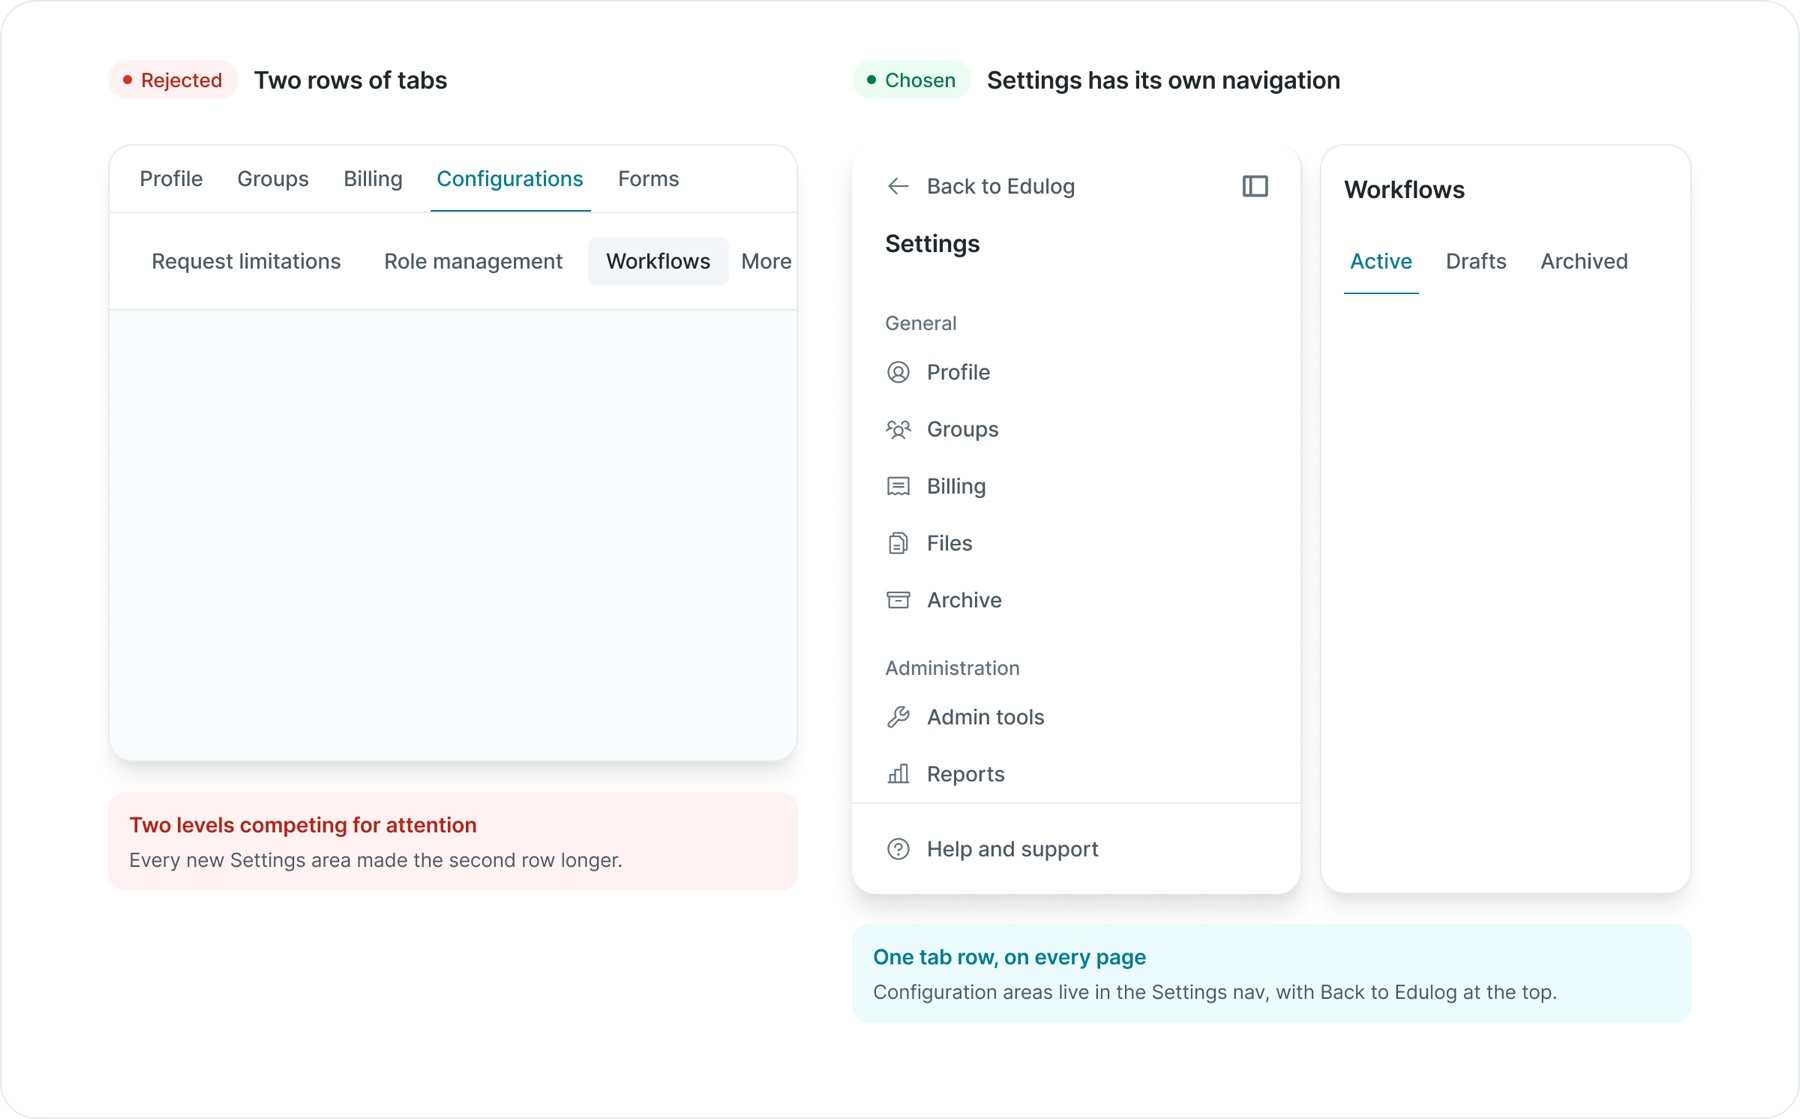
Two levels competing for attention
Every new Settings area made the second row longer.
Configuration areas live in the Settings nav, with Back to Edulog at the top.
The platform's structure should explain the work people can do.
Interaction
That same clarity needed to carry through to individual controls.
In early explorations, workflow objects had different colours by type. Combined with selection and status colours, the canvas offered too many competing signals. I moved toward neutral objects, a shared teal treatment for primary actions and interaction cues, and distinct status treatments.
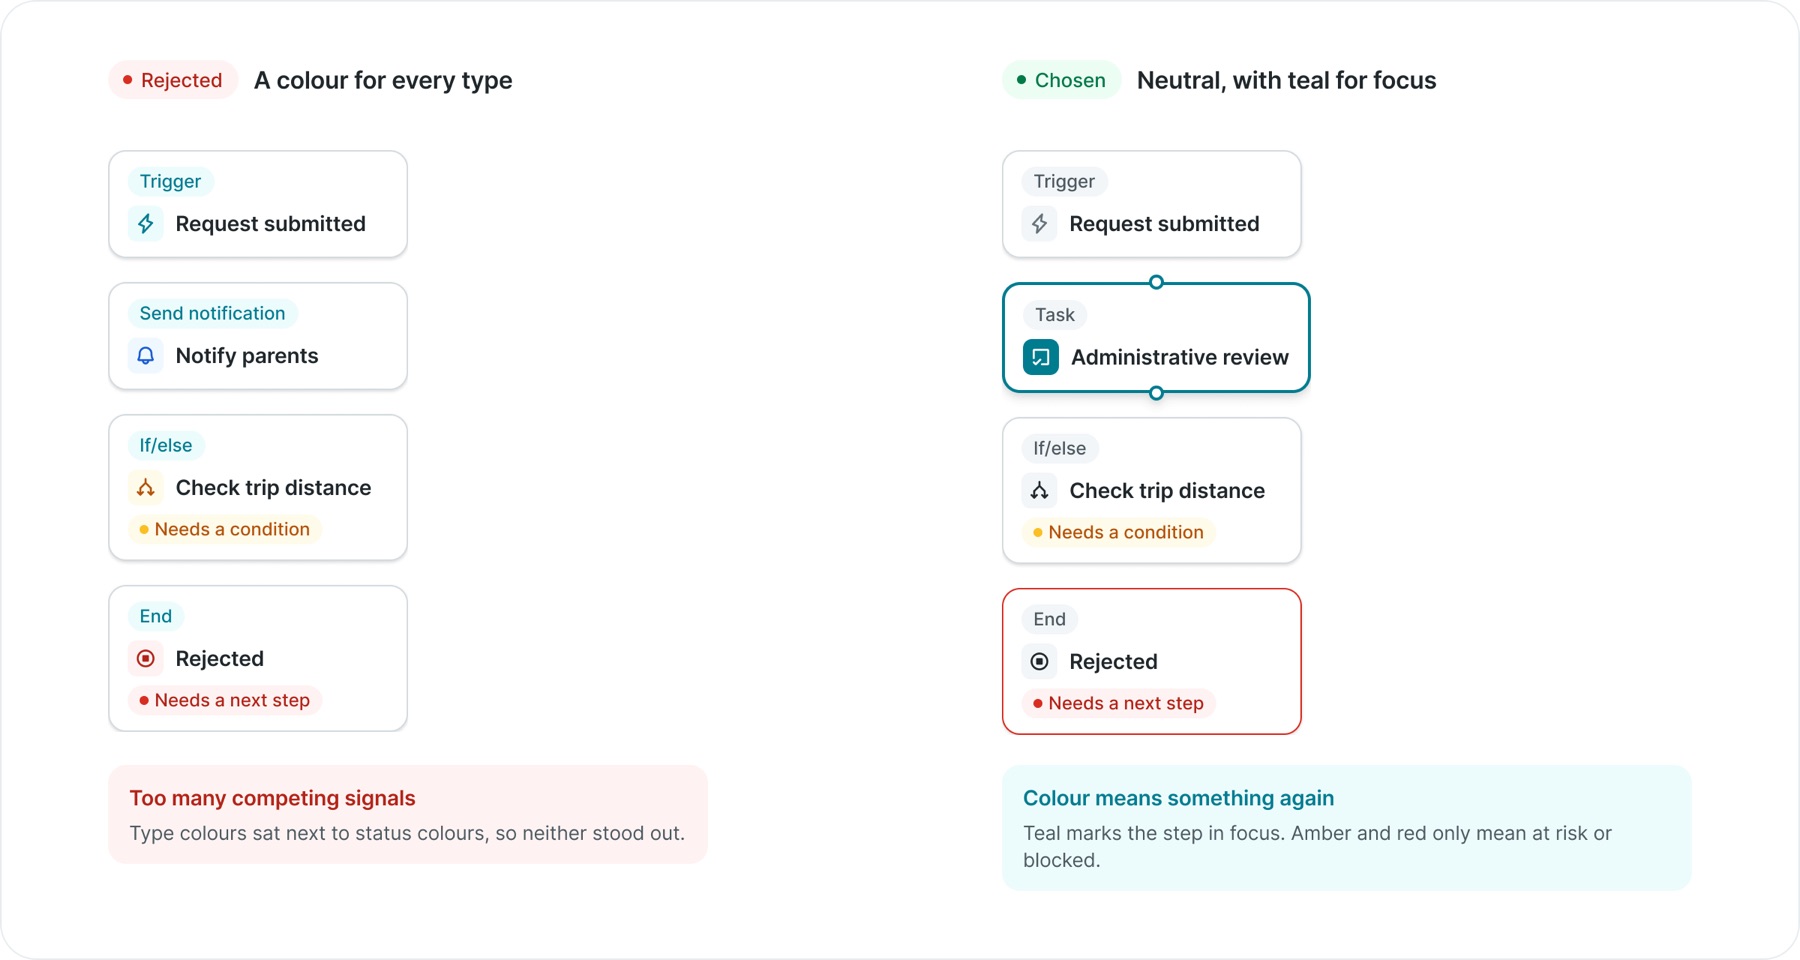
Type colours sat next to status colours, so neither stood out.
Teal marks the step in focus. Amber and red only mean at risk or blocked.
I also removed text-weight changes between interaction states, so selecting a tab or option would not shift the surrounding content. These small decisions became reusable rules across the system.
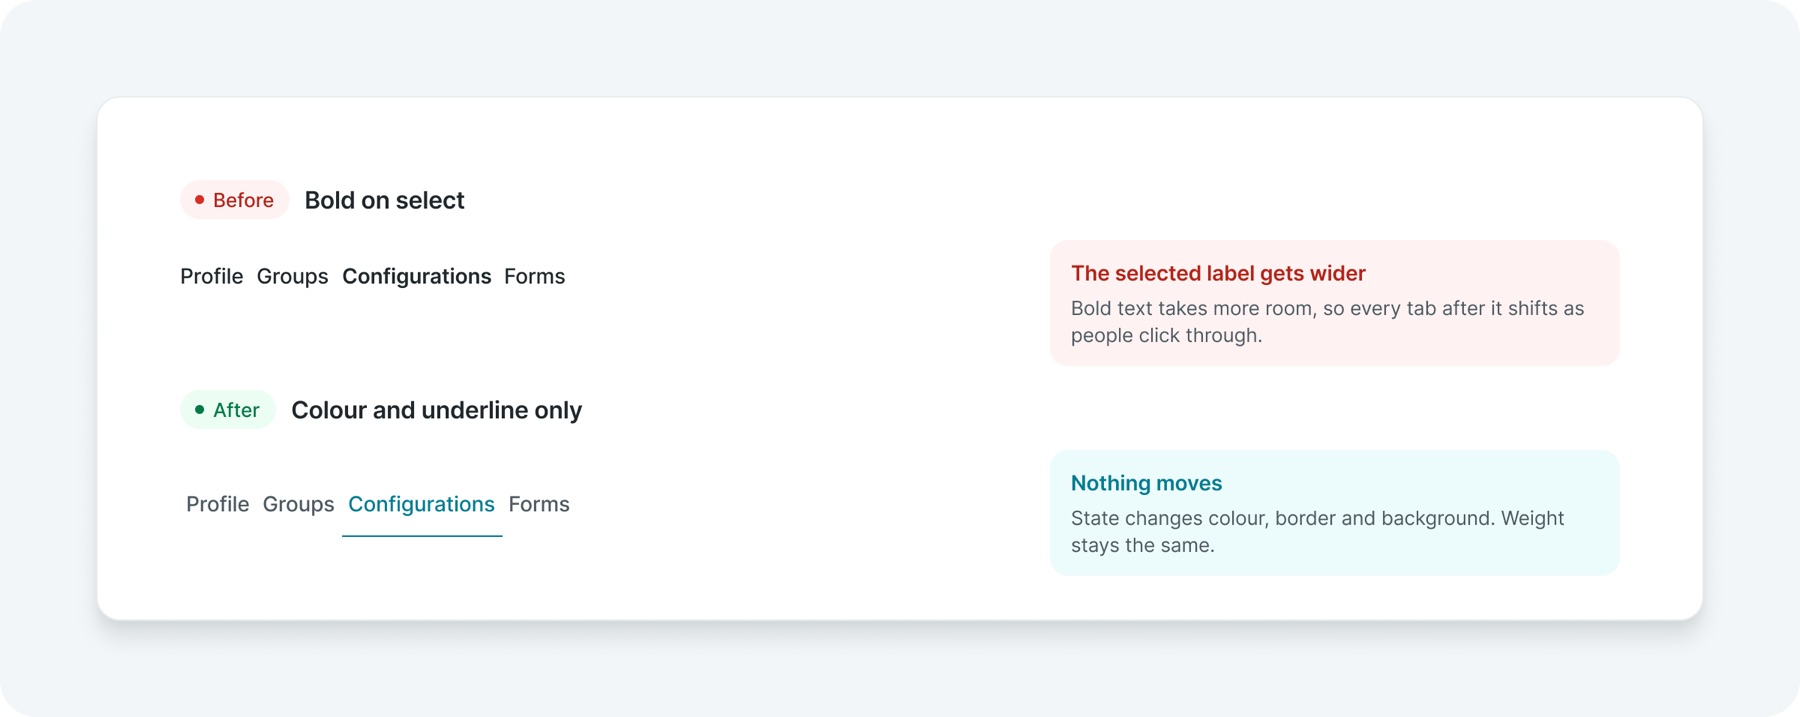
Bold text takes more room, so every tab after it shifts as people click through.
State changes colour, border and background. Weight stays the same.
A state should change how something looks, never where it sits.
Foundations
Start from the smallest decisions
Before buttons and form fields, there are the decisions they are made of: type, icons, colour, space, layout, motion, words and access. These came first, because every component inherits them, and a fix here reaches everything built on top.
01Typography
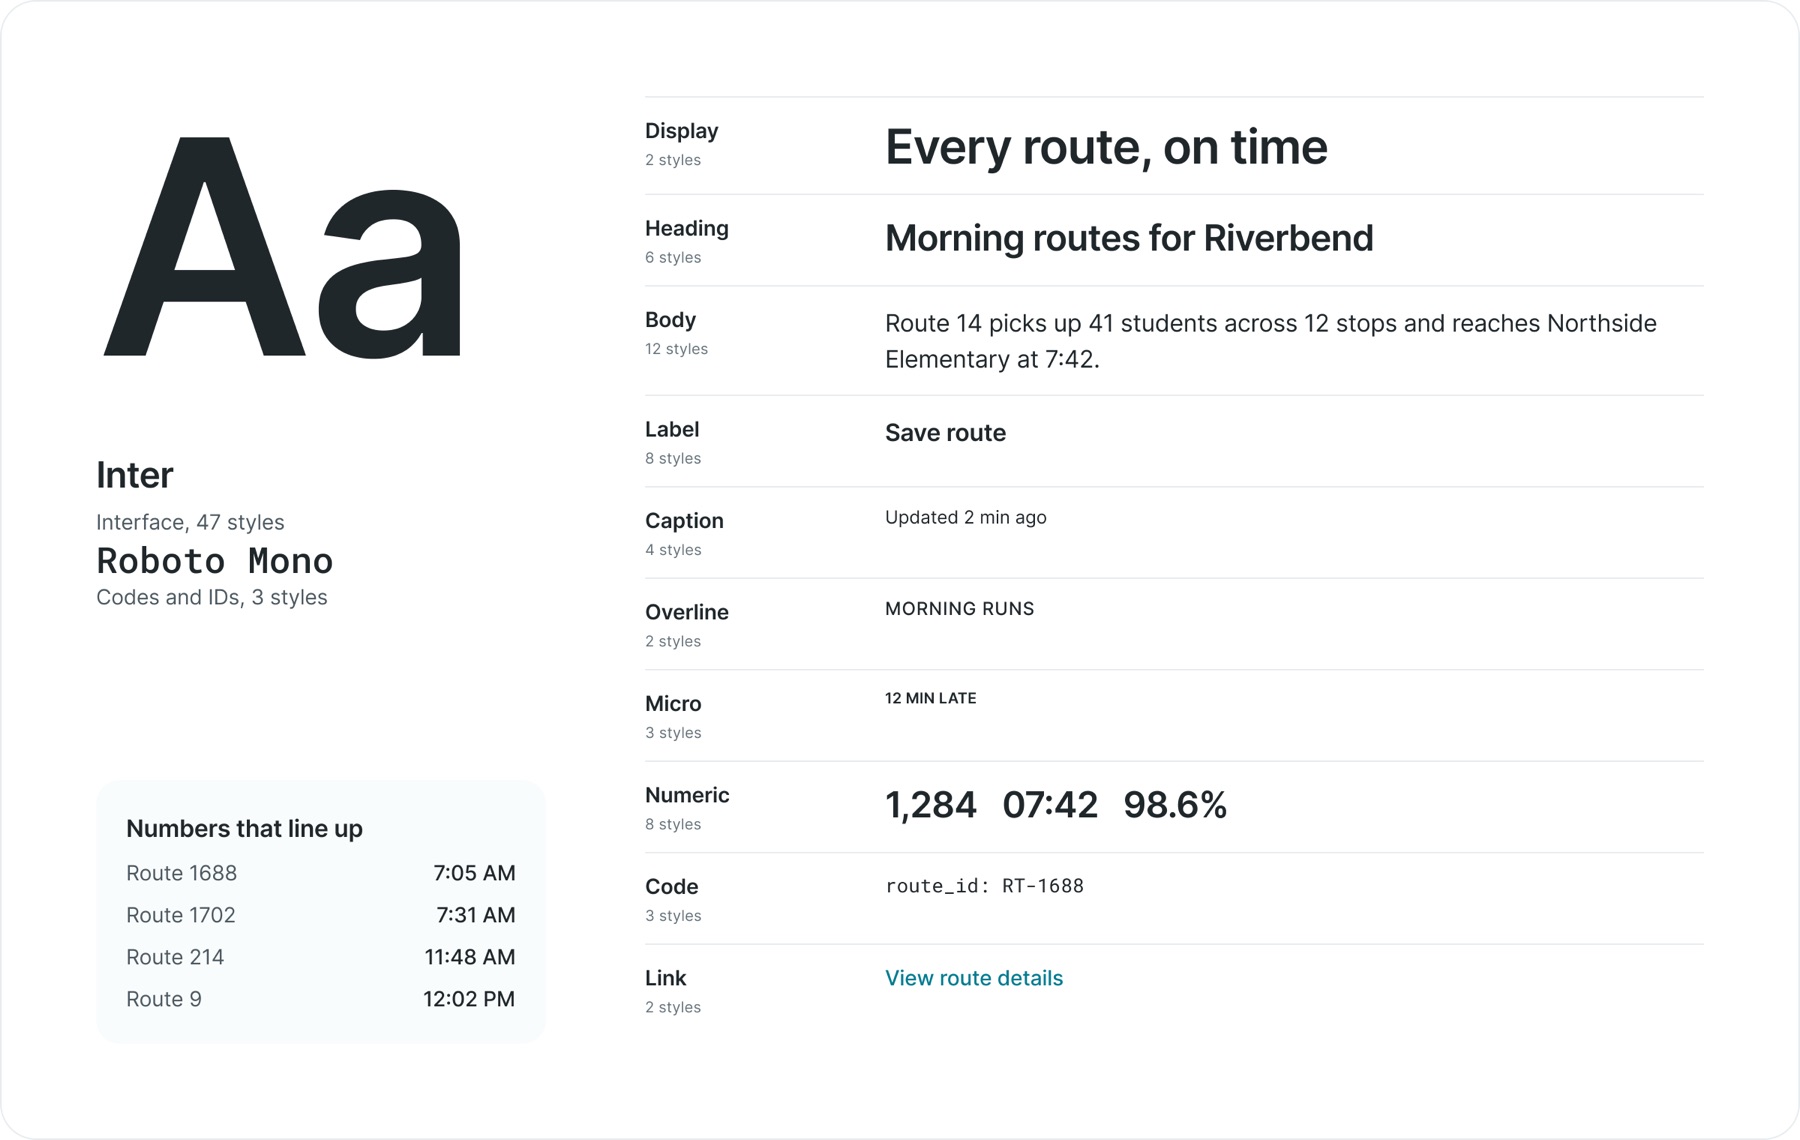
Inter carries the interface and Roboto Mono carries codes and IDs. Fifty styles in ten categories cover everything from a page title to a chart tick, and each one is bound to variables for family, size, weight and line height.
02Iconography
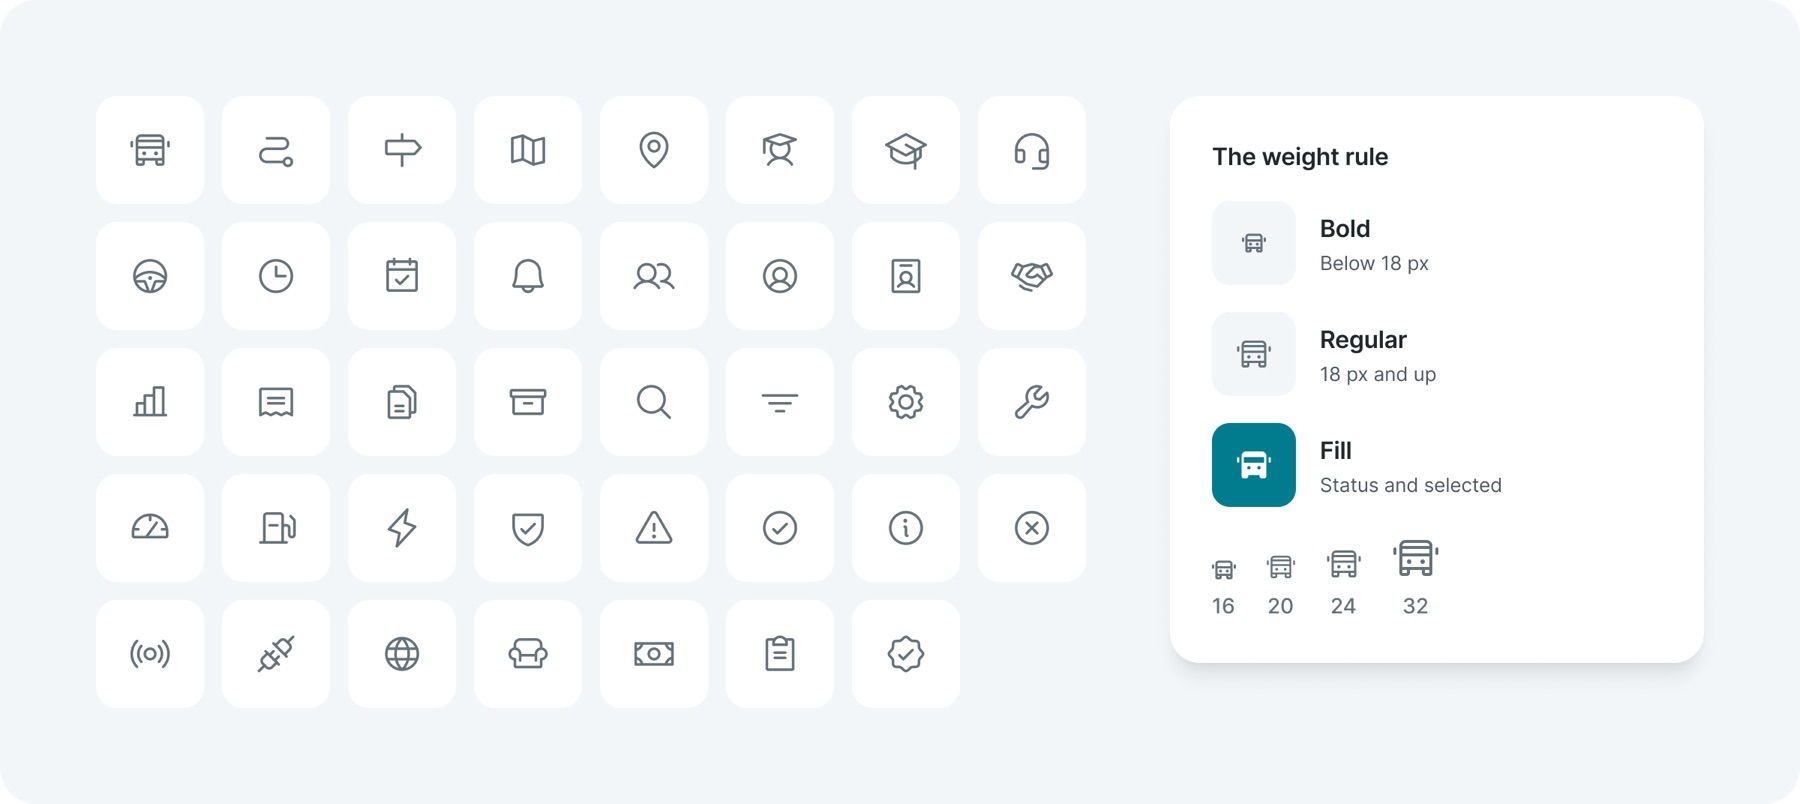
One family, Phosphor, with 1,513 icons. One rule decides the weight: Bold below 18 px so small icons stay crisp, Regular from 18 px up, and Fill only for status and selected items.
03Colour
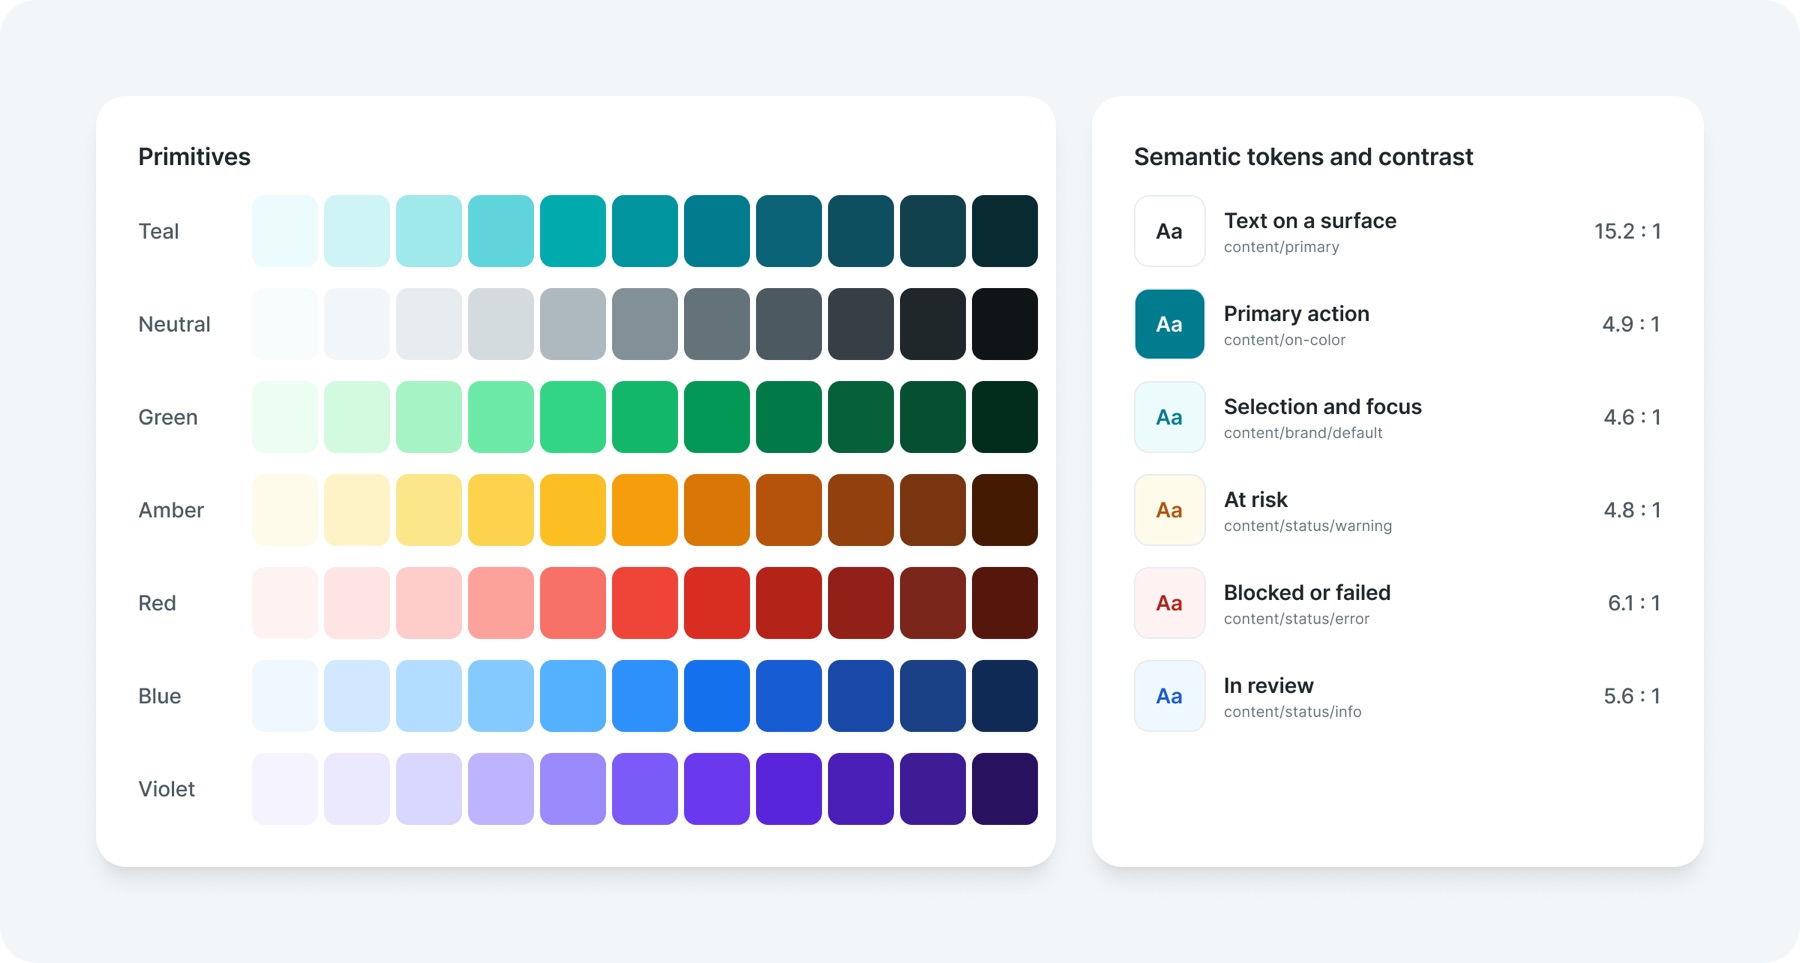
Status colours only ever mean status. Teal is kept for focus, selection and the main action.
04Space, radius and depth
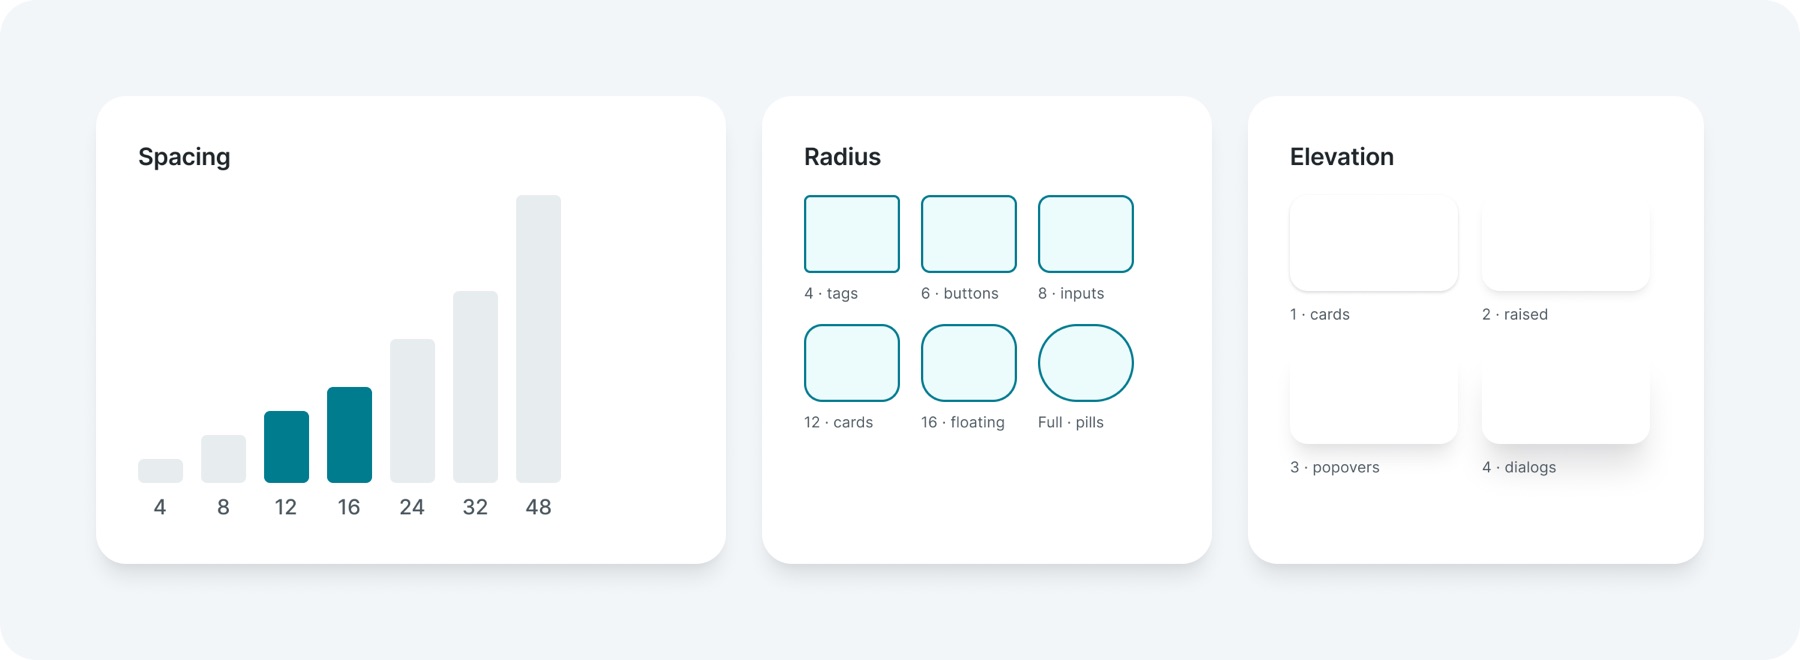
Spacing runs on a 4 px base, and inside components 12 and 16 do most of the work, which keeps dense screens compact without feeling cramped. Buttons use a 6 px radius, cards 12 and floating surfaces 16. Four levels of elevation separate what sits on the page from what floats above it.
05Layout
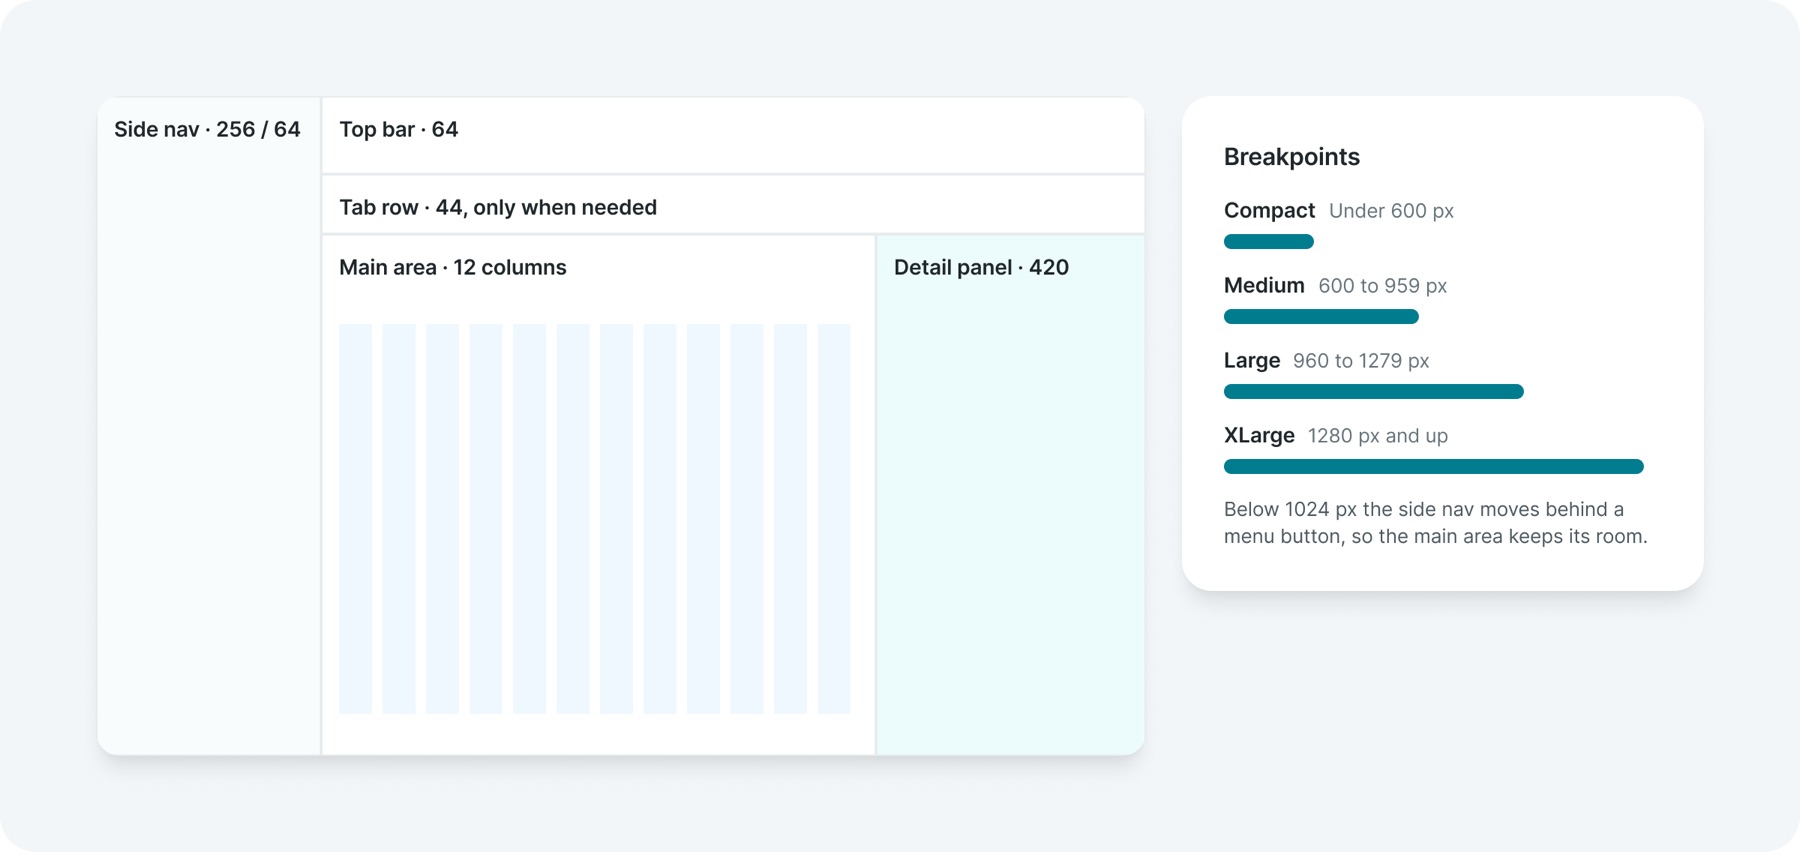
One shell holds every page: a 256 px side nav that collapses to a 64 px rail, a 64 px top bar, and a 420 px detail panel that pushes the page narrower instead of covering it. Four breakpoints follow the width of the main area, not the screen.
Below 1024 px the side nav moves behind a menu button, so the main area keeps its room.
06Motion
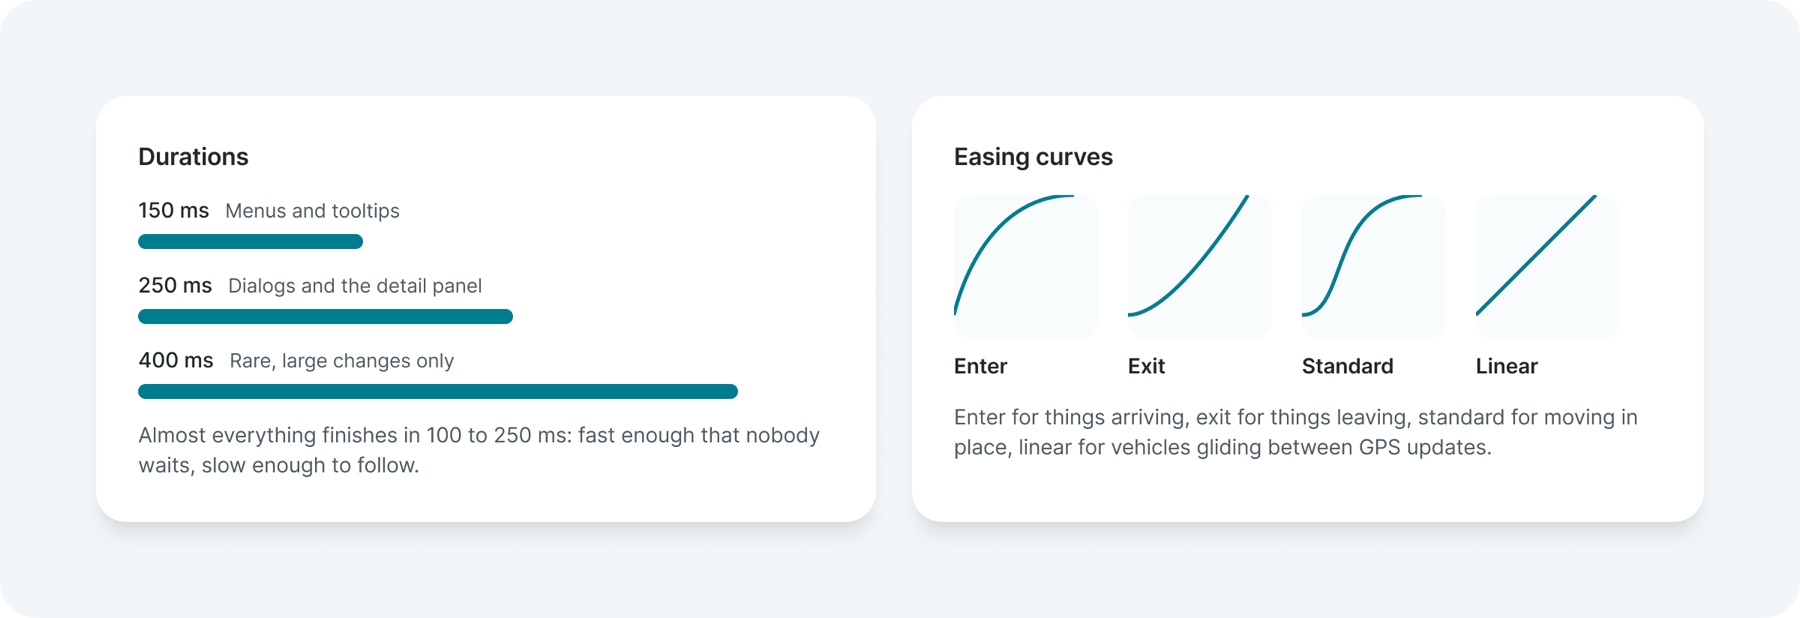
Motion is quick, it never blocks work, and it switches off for anyone who asks their device to reduce motion. Six durations and four easing curves cover every animation, stored as variables so engineering uses the same values.
Almost everything finishes in 100 to 250 ms: fast enough that nobody waits, slow enough to follow.
Enter for things arriving, exit for things leaving, standard for moving in place, linear for vehicles gliding between GPS updates.
07Content
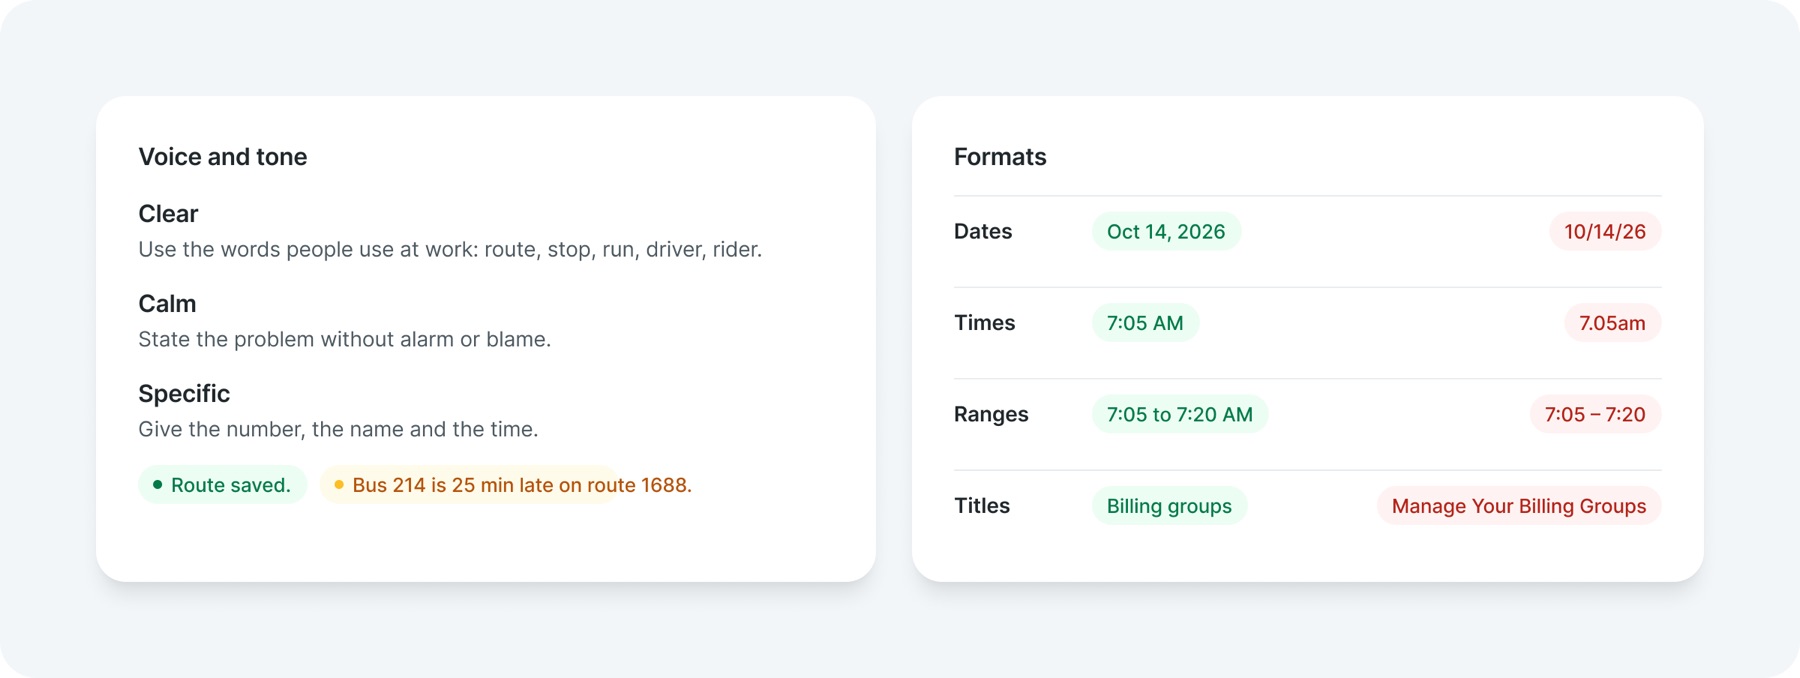
Words are part of the system too. People scan rather than read, so the important word comes first, everything is sentence case, and dates and times use one format that cannot be misread.
08Accessibility
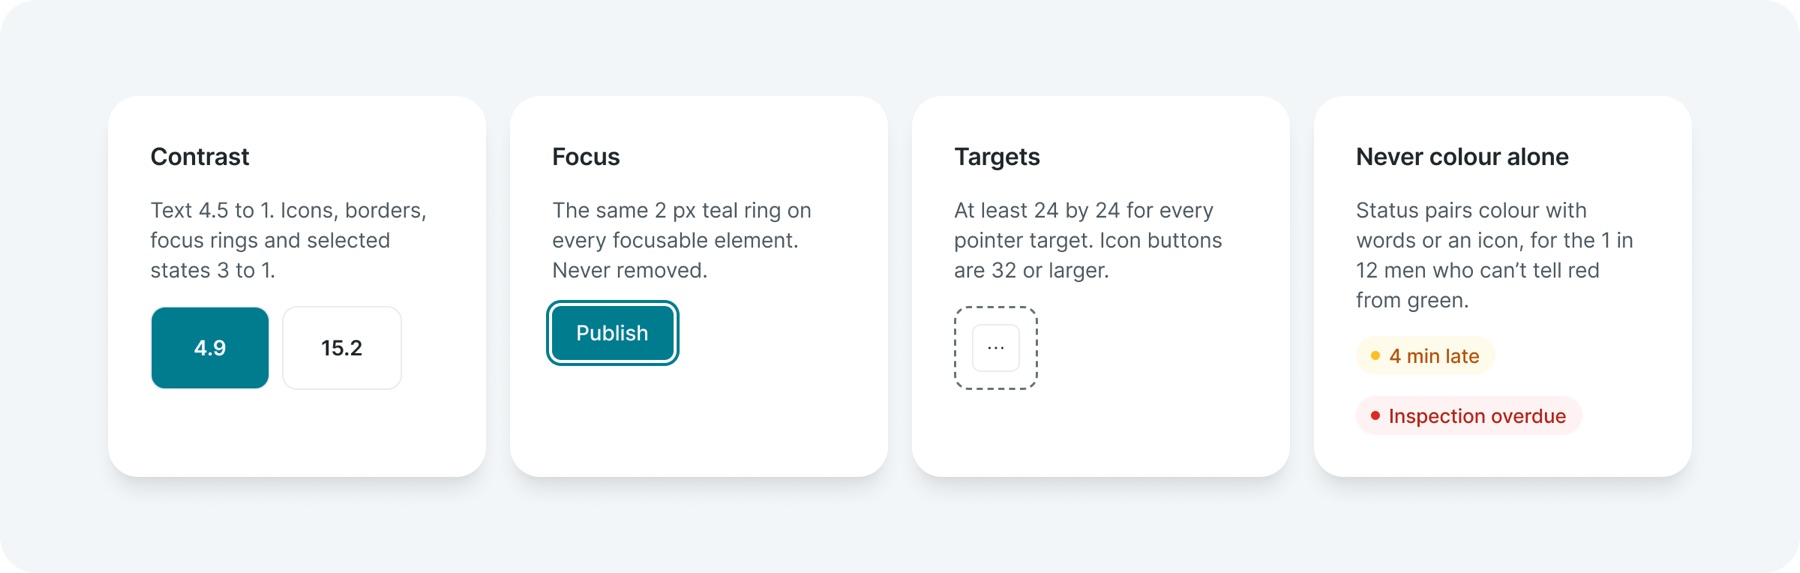
Every screen is checked against WCAG 2.2 AA while it is designed, not after. Most of the work is carried by the components, so a team assembling a screen inherits contrast, focus and target sizes by default.
Reusable parts
Turn decisions into reusable parts
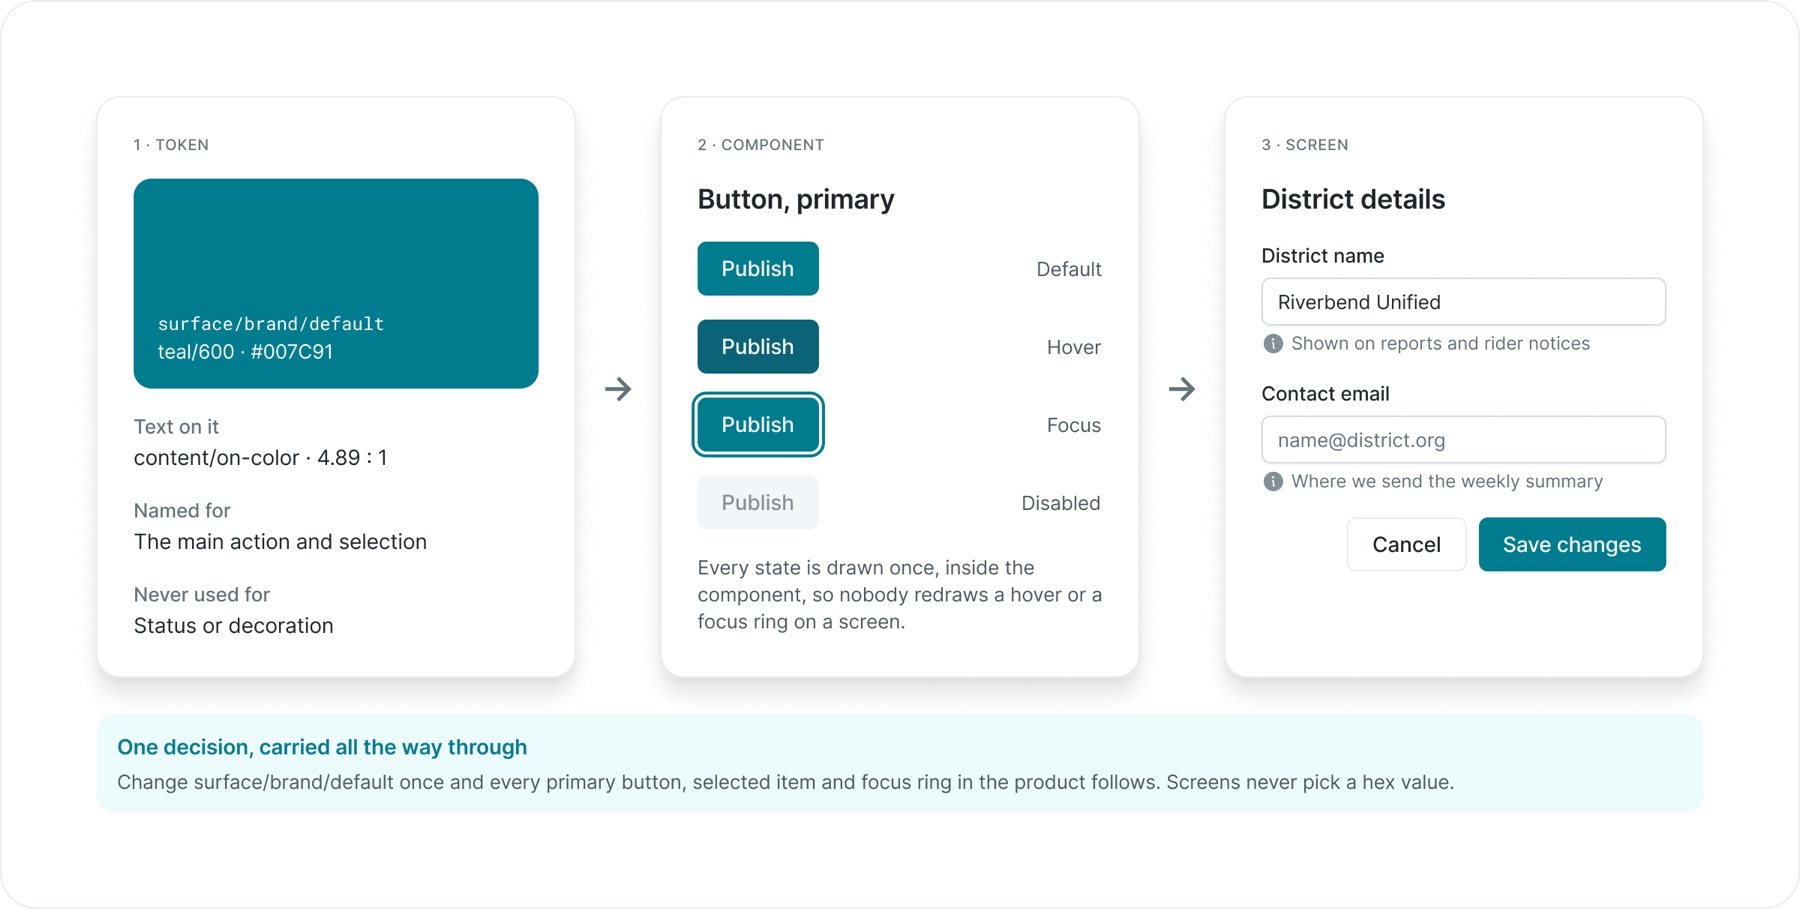
Semantic tokens gave colours and surfaces names based on their purpose. Components brought those decisions into buttons, inputs, navigation and feedback. Shared patterns then addressed recurring situations such as filtering a list, editing settings, searching records and working with maps.
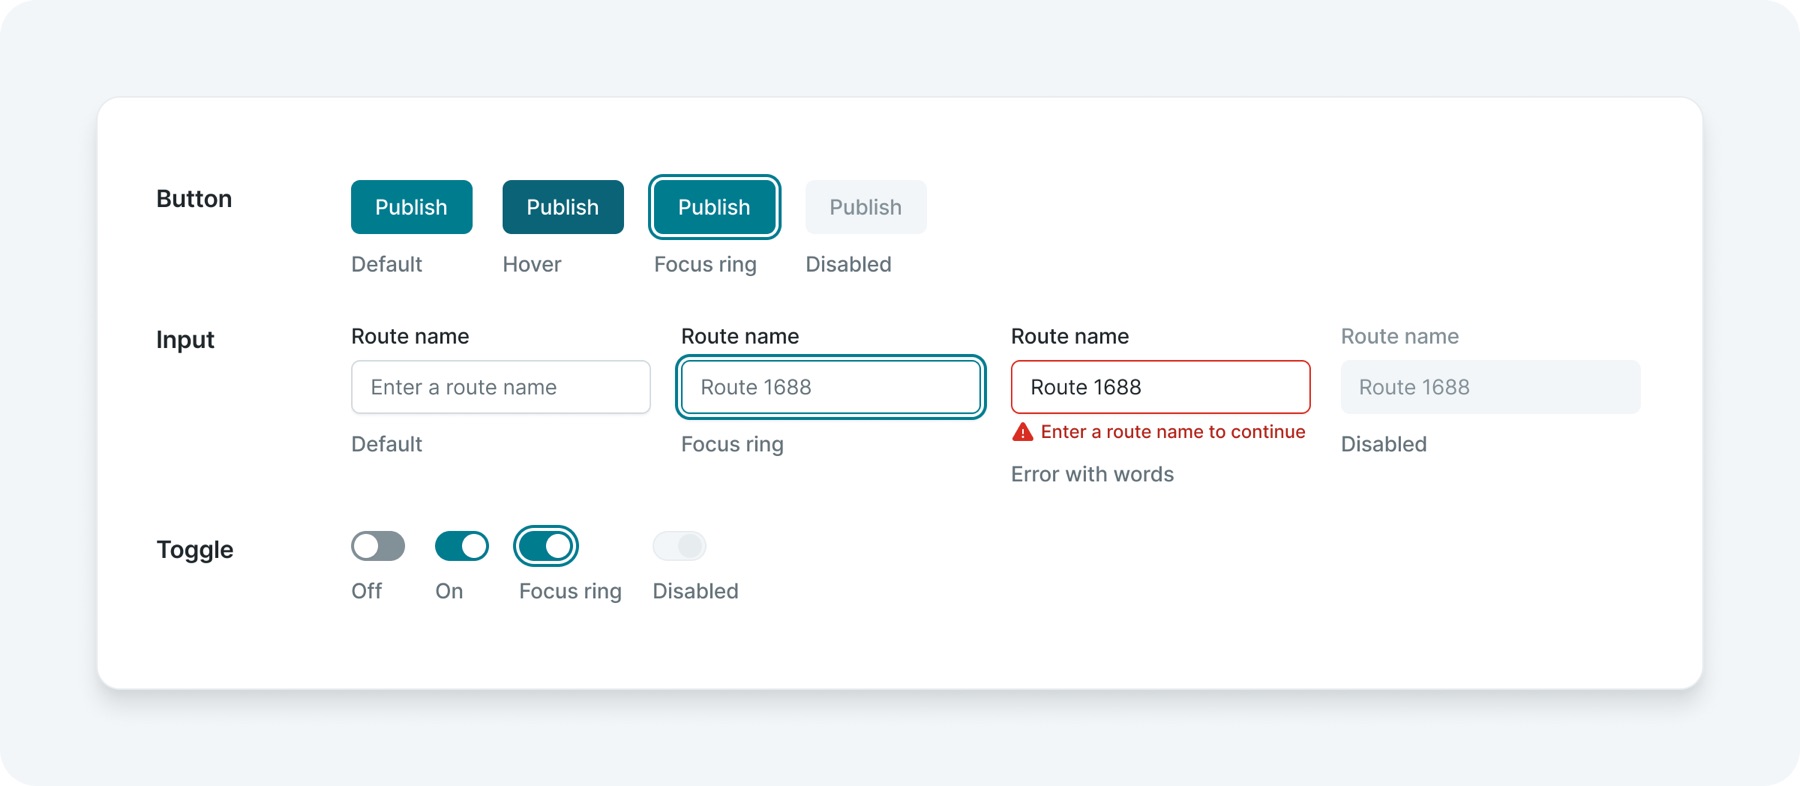
The token-to-button example illustrates the connection: a foundation decision carries through the component into the screen where someone uses it.
Every state is drawn once, inside the component, so nobody redraws a hover or a focus ring on a screen.
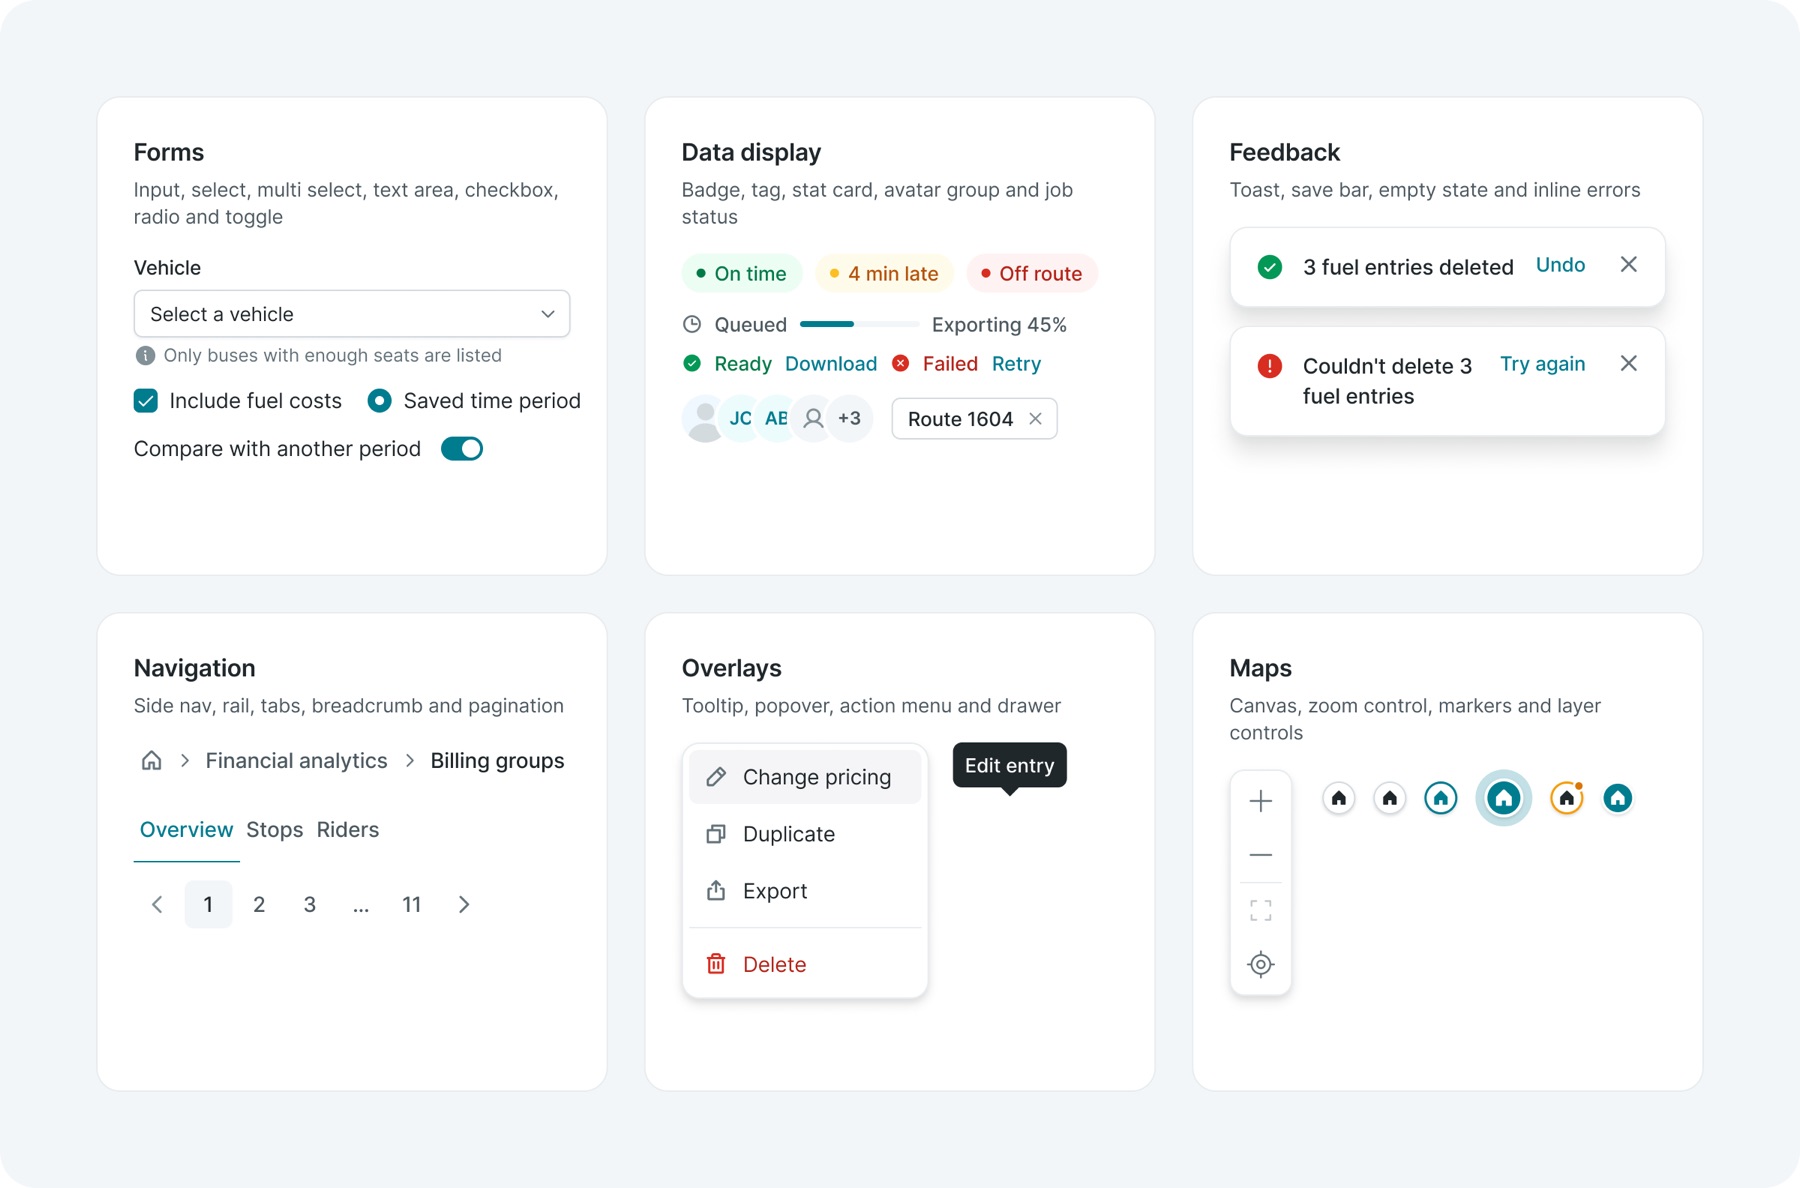
The library is grouped by the job a part does, not by how it looks. Each family ships with every state it needs, so a team building a screen picks a part and gets its hover, focus, error and disabled states for free.
Patterns
Solve a situation once, then reuse the answer
Components answer "what does a button look like". Patterns answer "what happens when someone needs to narrow a list of 4,000 stops" or "how do I know my changes were saved". They combine components into a fixed arrangement with rules, so the same situation behaves the same way in every tool.
01List pattern
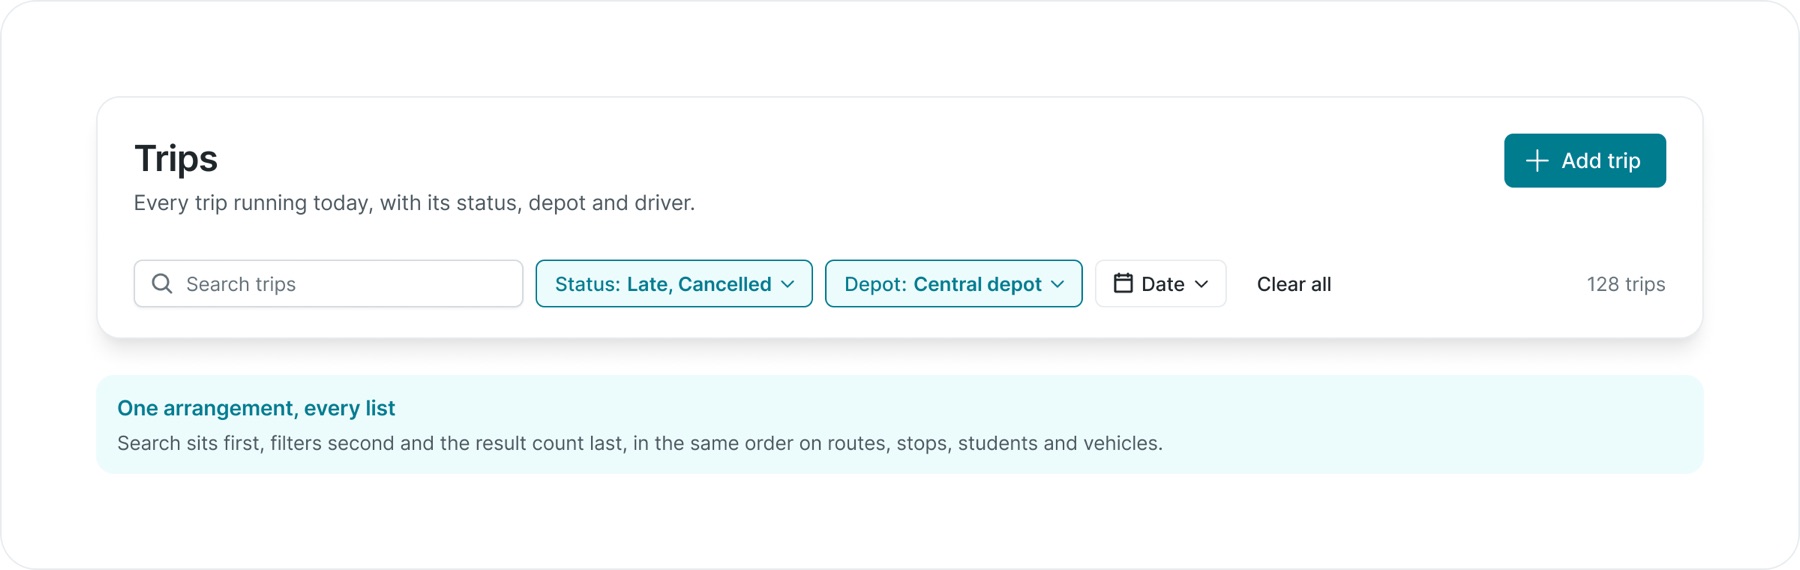
Every list page opens with the same page header and the same filter bar. Applied filters stay visible as highlighted chips beside the search, with Clear all next to them and the result count at the end.
Search sits first, filters second and the result count last, in the same order on routes, stops, students and vehicles.
02Settings pattern
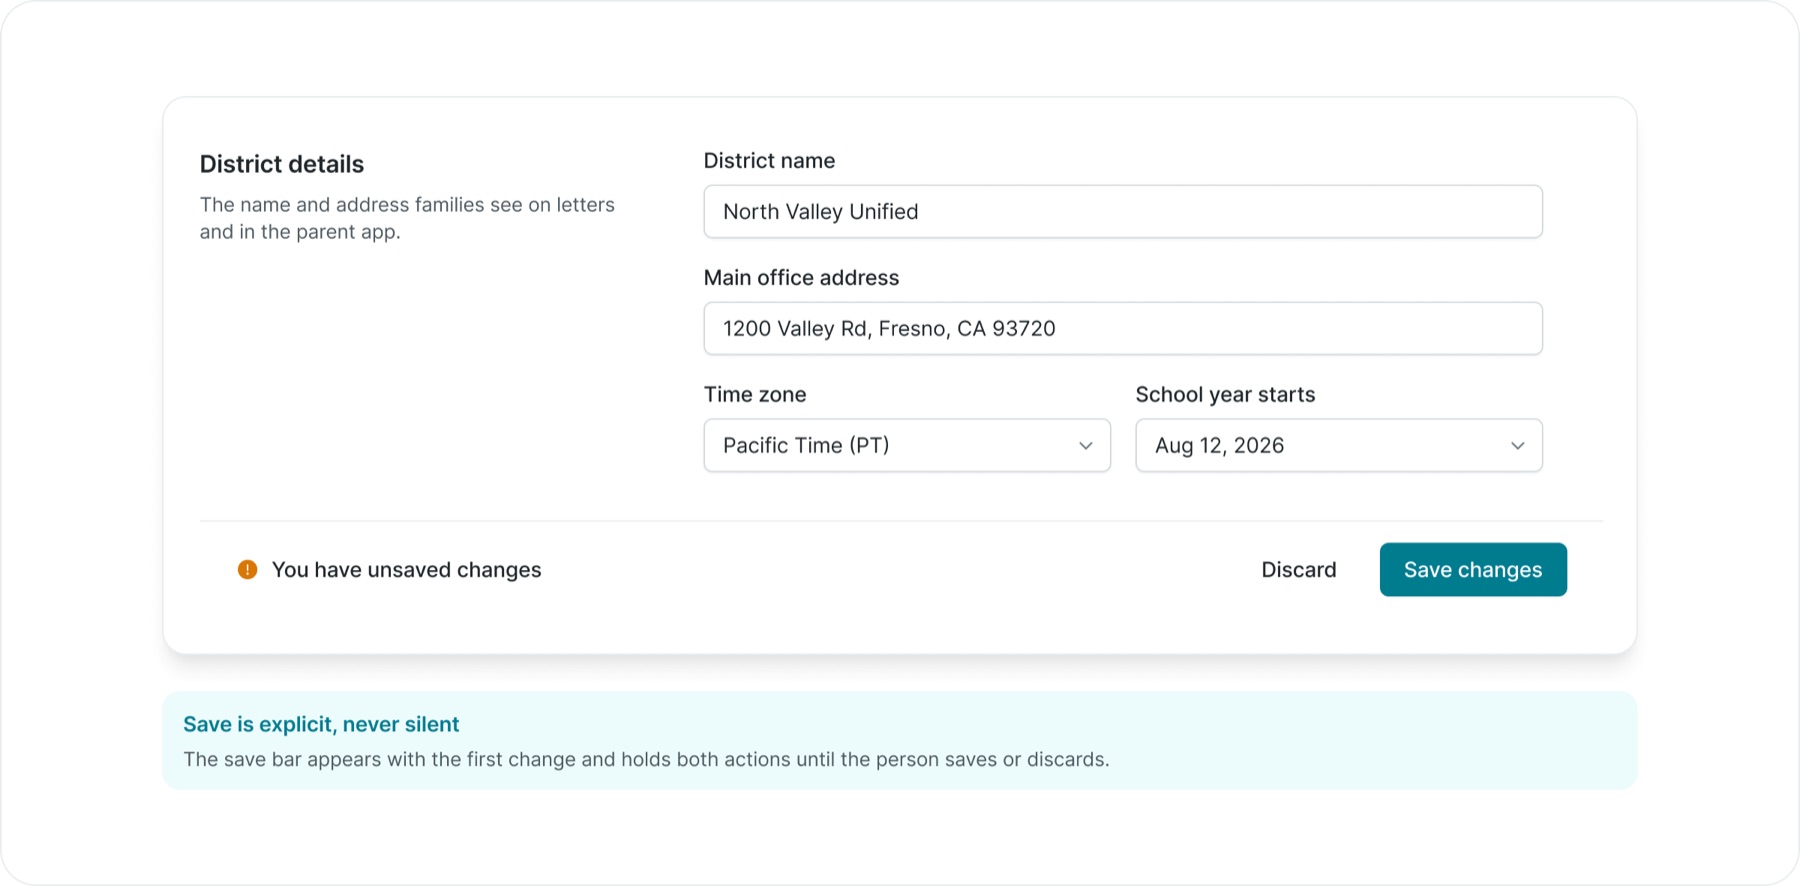
Settings pages group fields into labelled sections with a description on the left. Changes collect in a save bar that appears only when something has changed, so nothing is saved by accident and nothing is lost by navigating away.
The save bar appears with the first change and holds both actions until the person saves or discards.
03Work that runs in the background
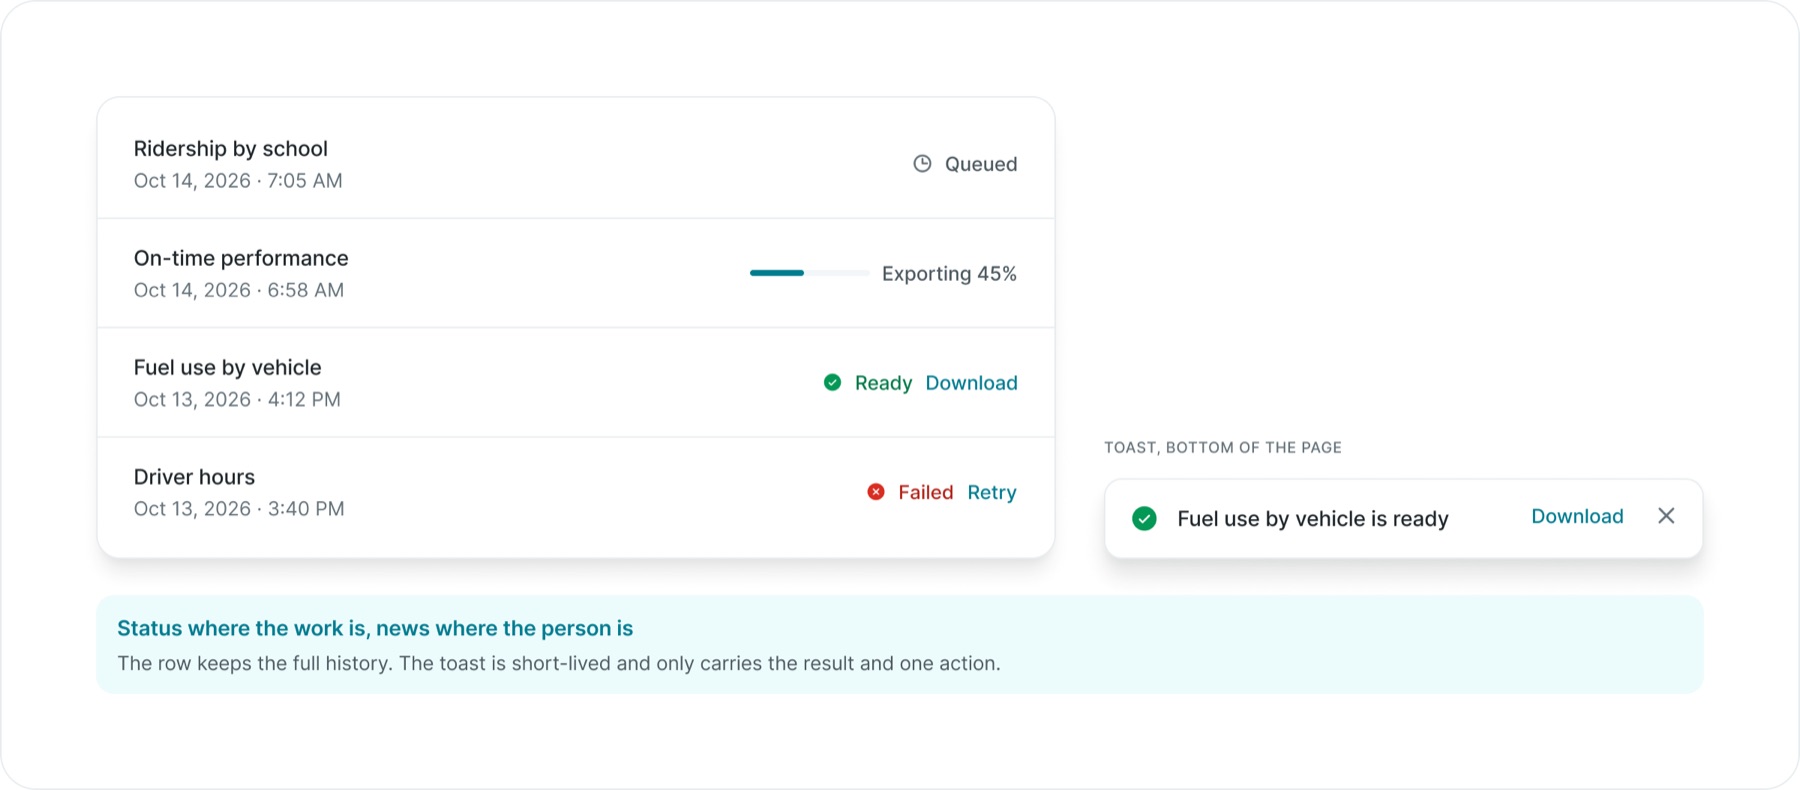
Reports, imports and route optimisation can take minutes. They never block the page: the status lives on the row, and a toast says when the work is done, with the next step in it.
Status where the work is, news where the person is. The row keeps the full history. The toast is short-lived and only carries the result and one action.
04Empty states
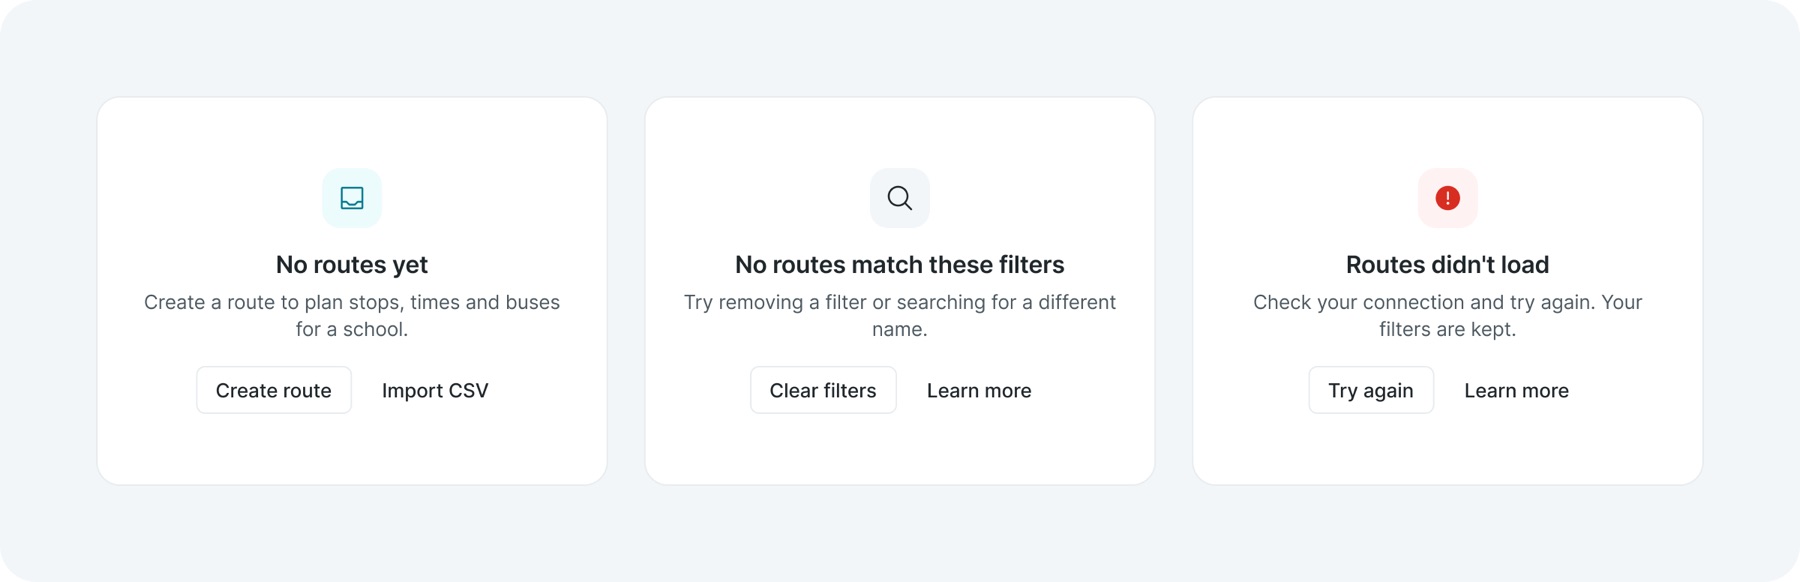
An empty table tells people nothing. Each empty state says why the space is empty and what to do next, in one of four designed cases: first use, no results, an error and no access.
Put the system to work
The real test was the next product, not the library
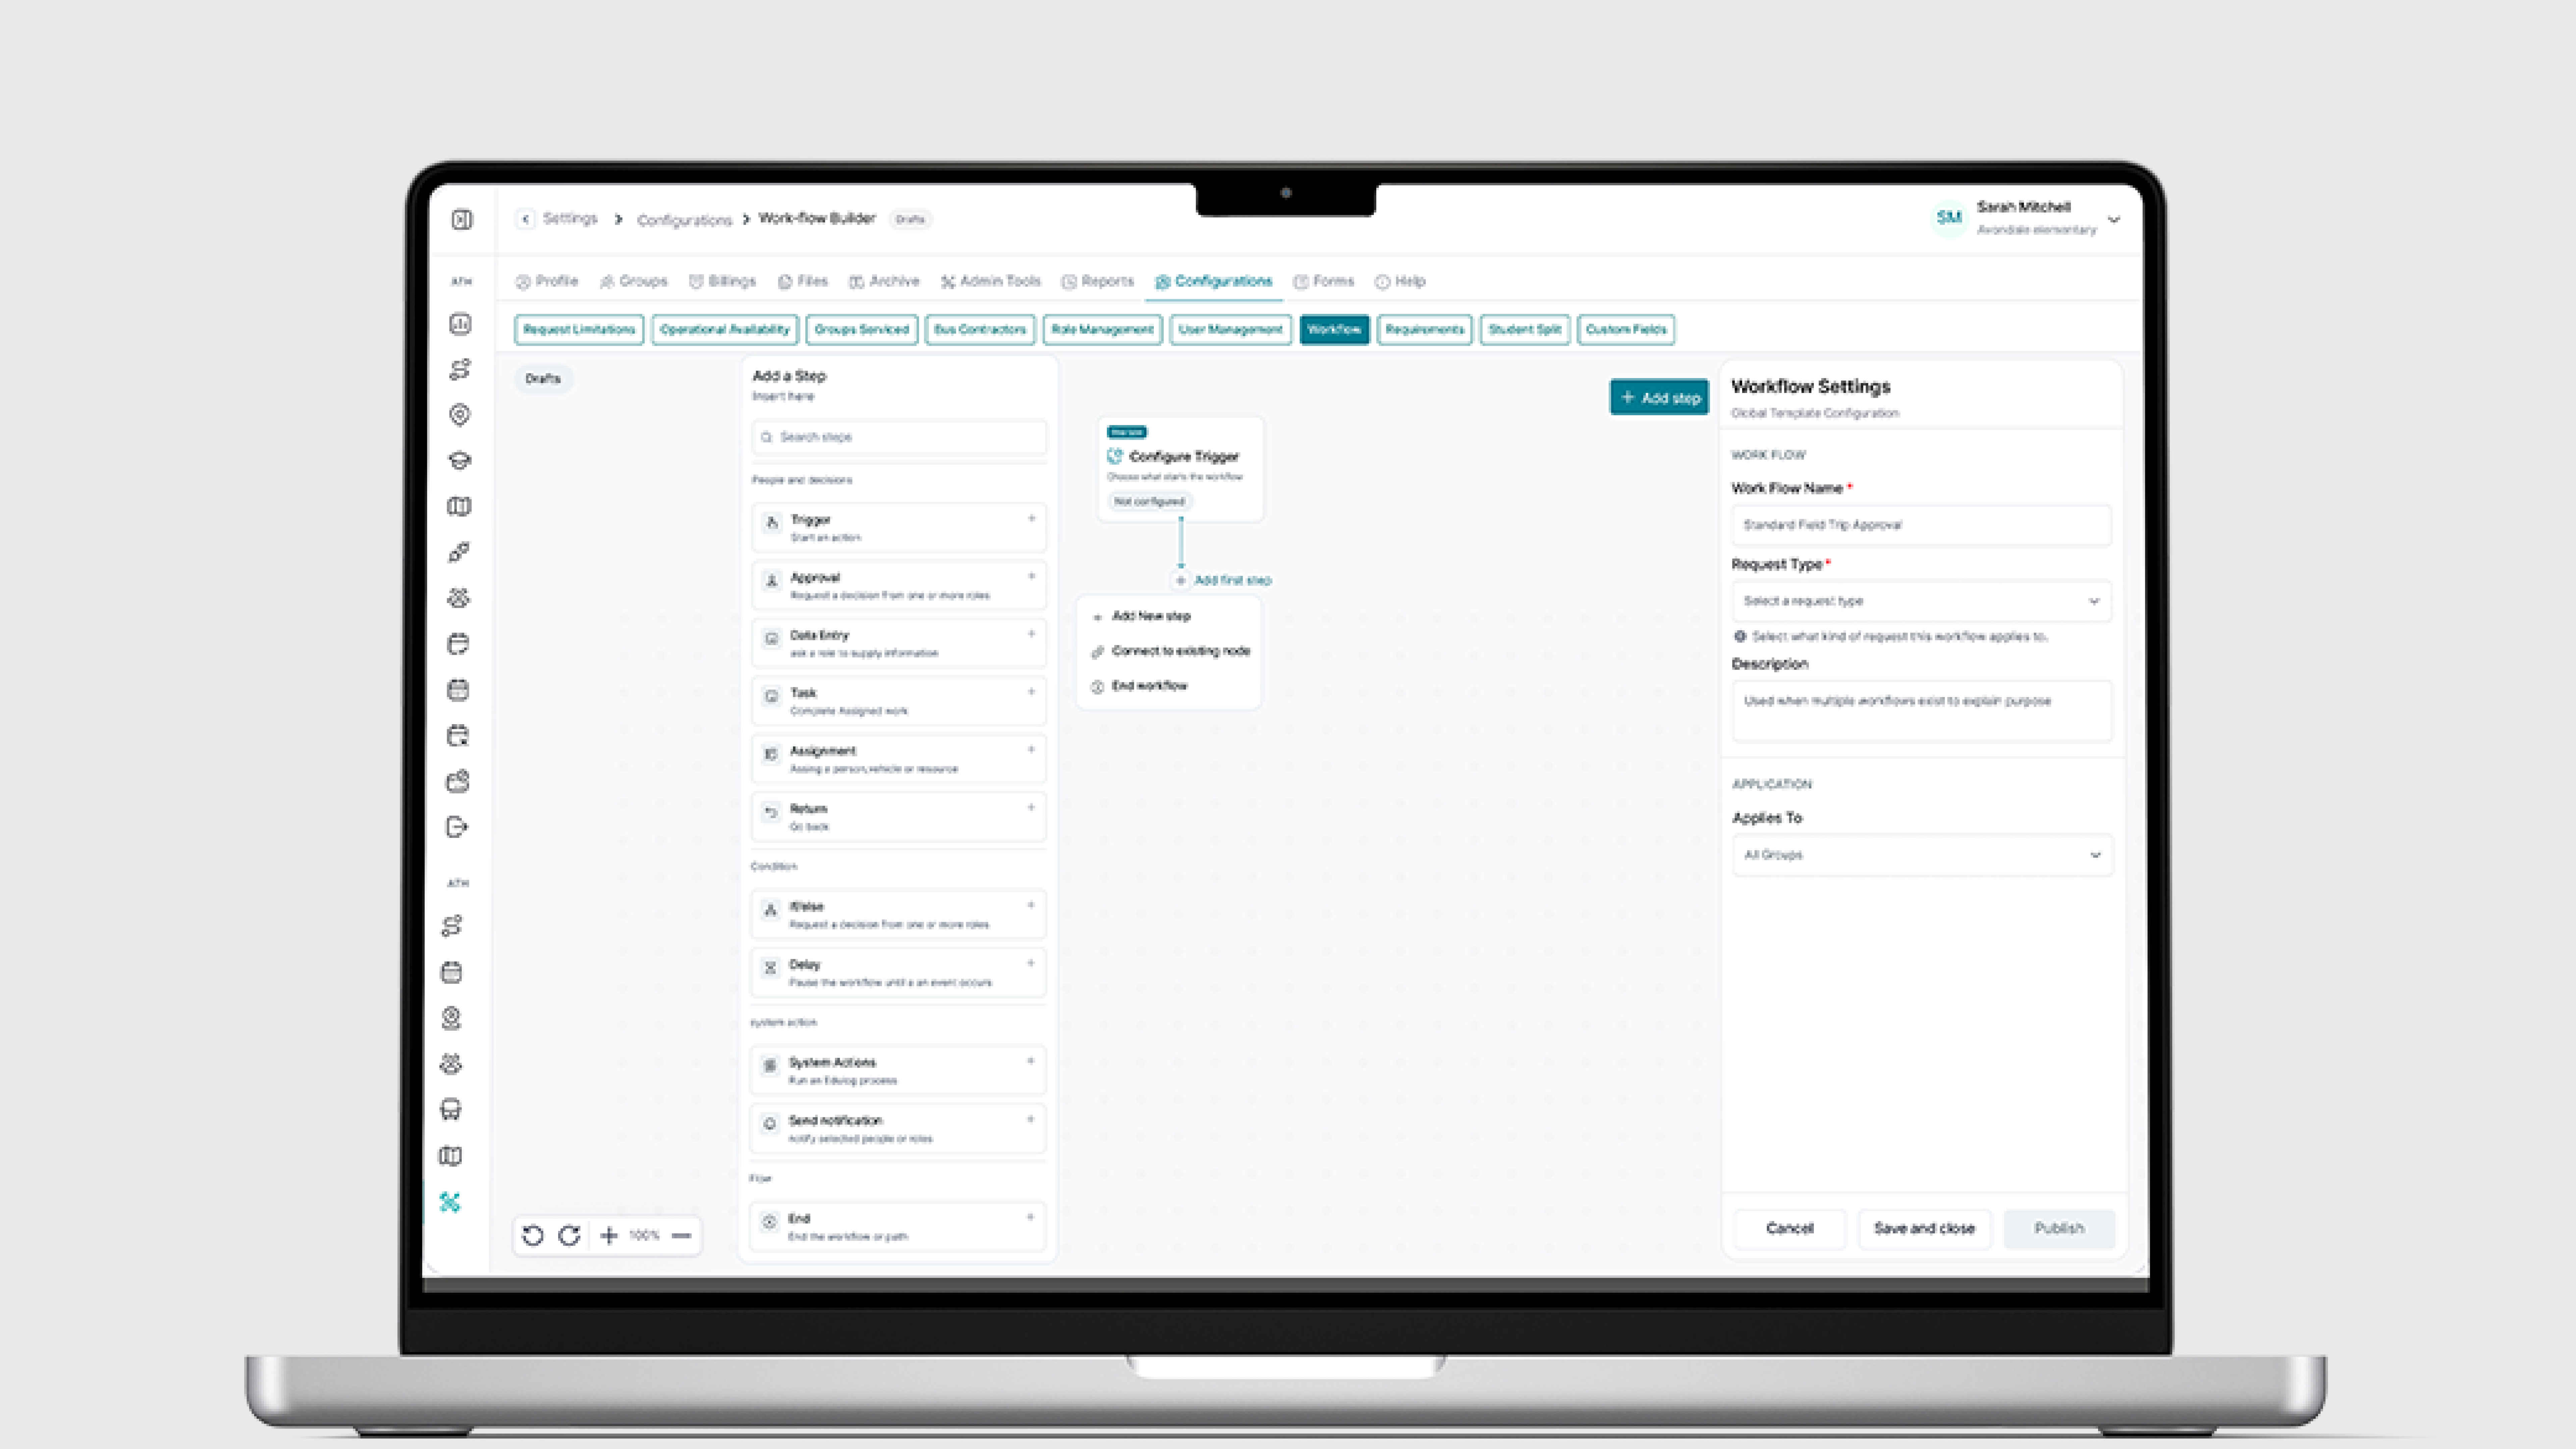
A library proves nothing until someone builds with it. Three very different tools were designed on top of the system: Geocode, a map editor for addresses and roads; global search, which finds any record from anywhere; and the workflow builder, a canvas for automating approvals. Each one is shown below with the parts it took from the system and the parts it had to add.
01Geocode
The most demanding tool in Edulog: a full-screen map with a floating editor. It used the shell, form fields and controls as they were, and its new map parts were later promoted into the system so other tools could use them.
Reused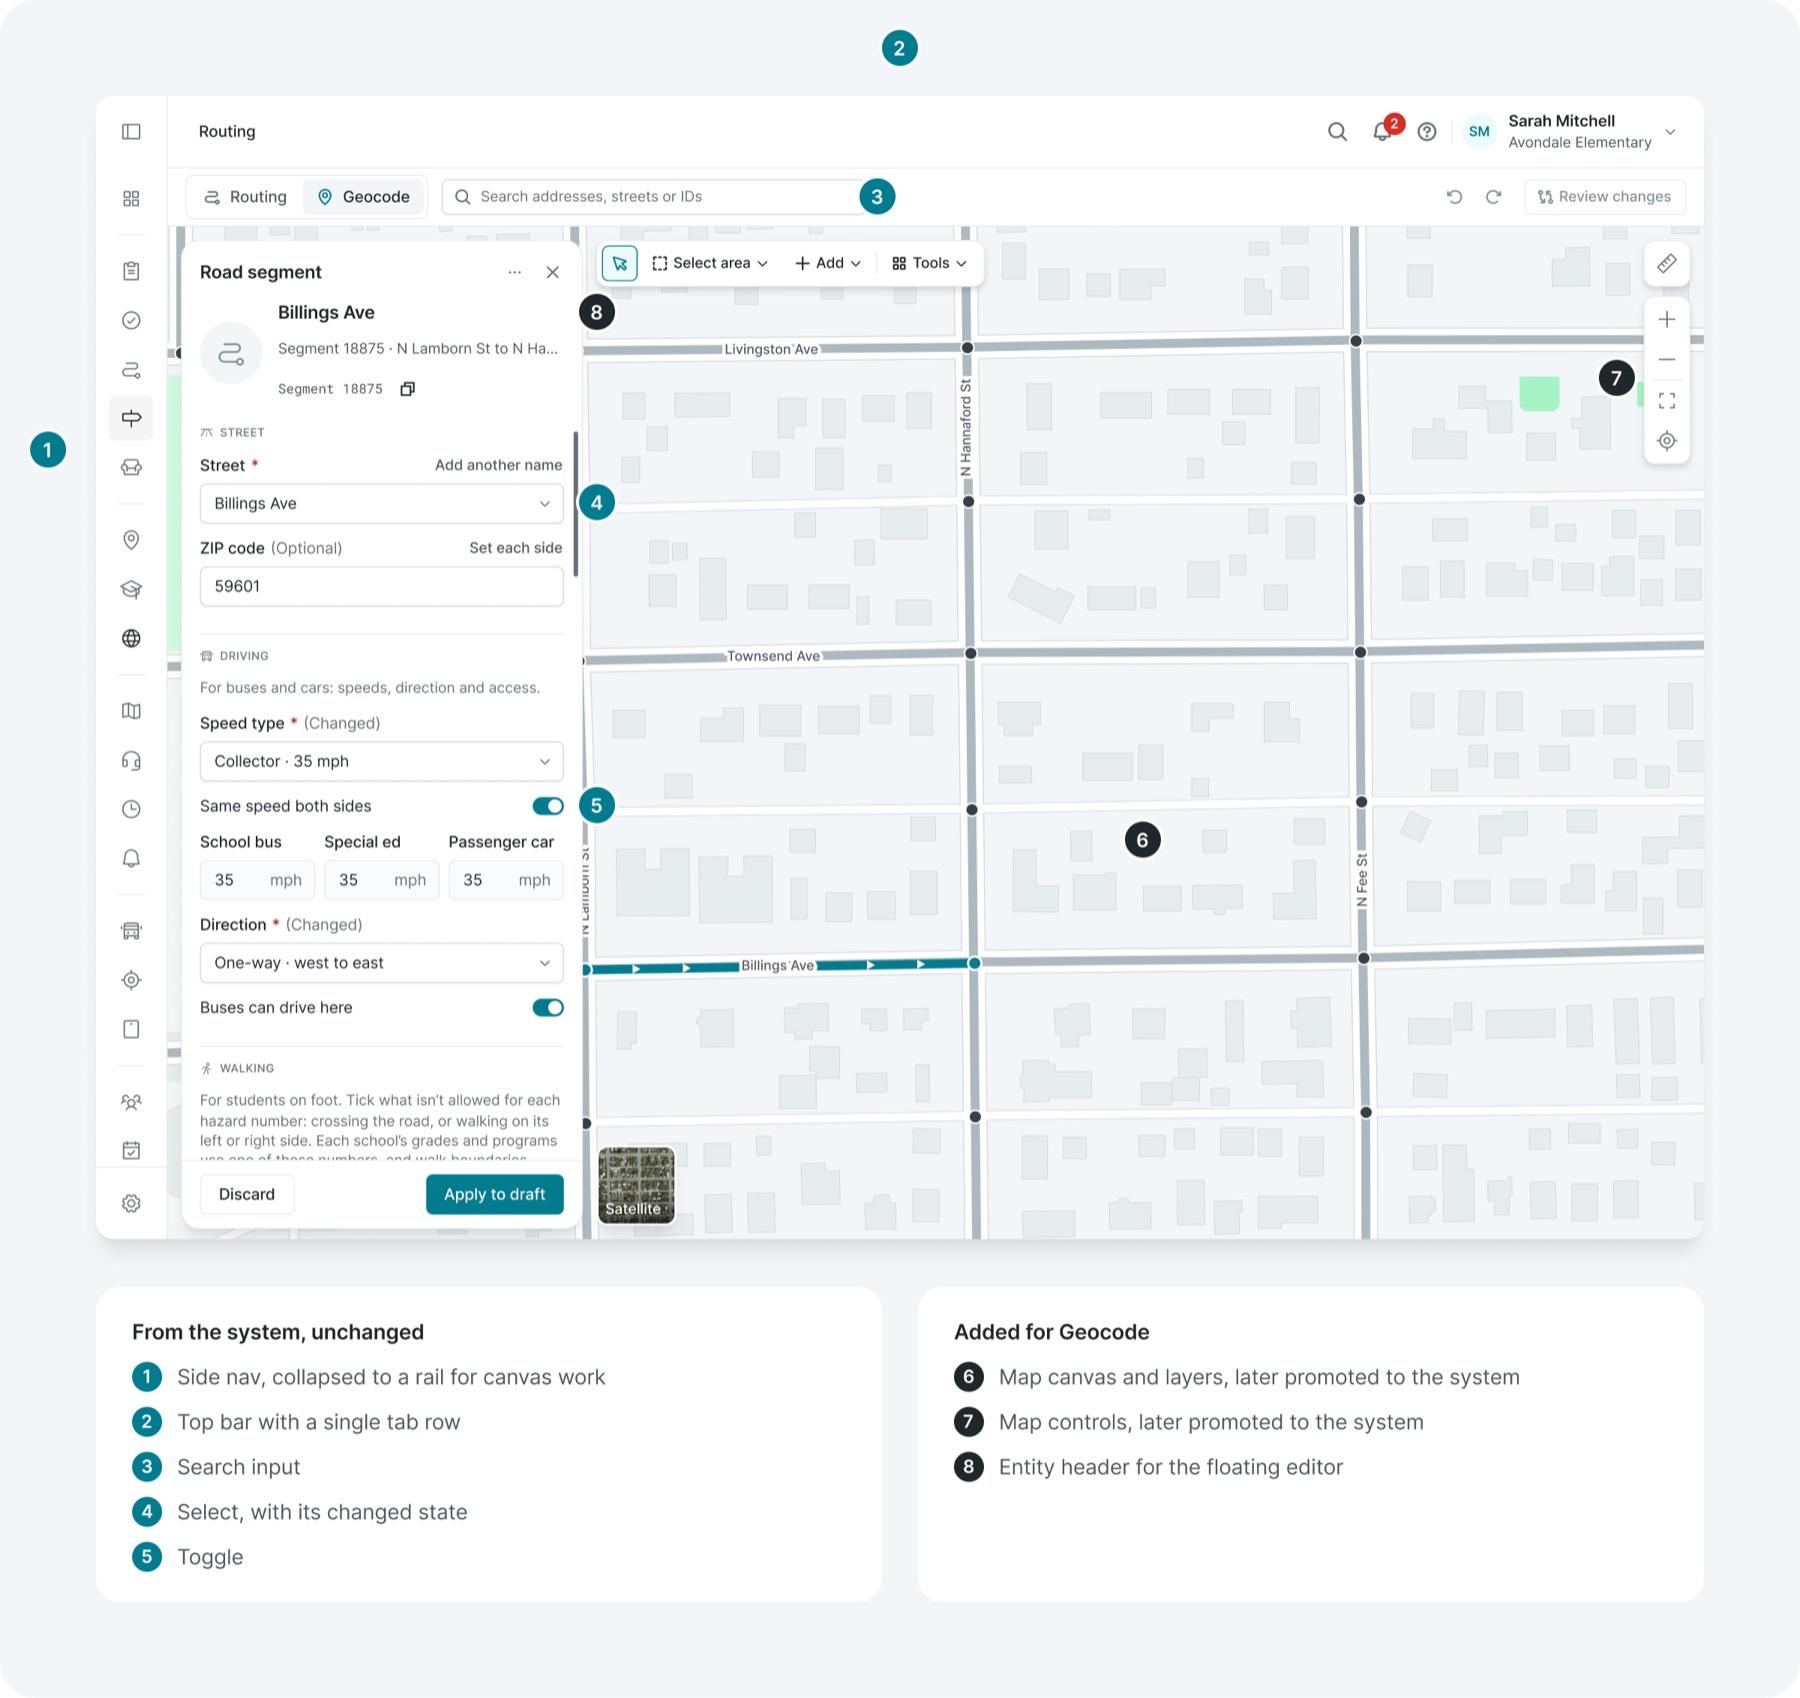
02Global search
Search had to work over any page in any tool. It opens over the current page on the shared scrim, and it needed only three new parts: a result row, a group header and a footer with keyboard hints. Everything around it was already in the system.
Reused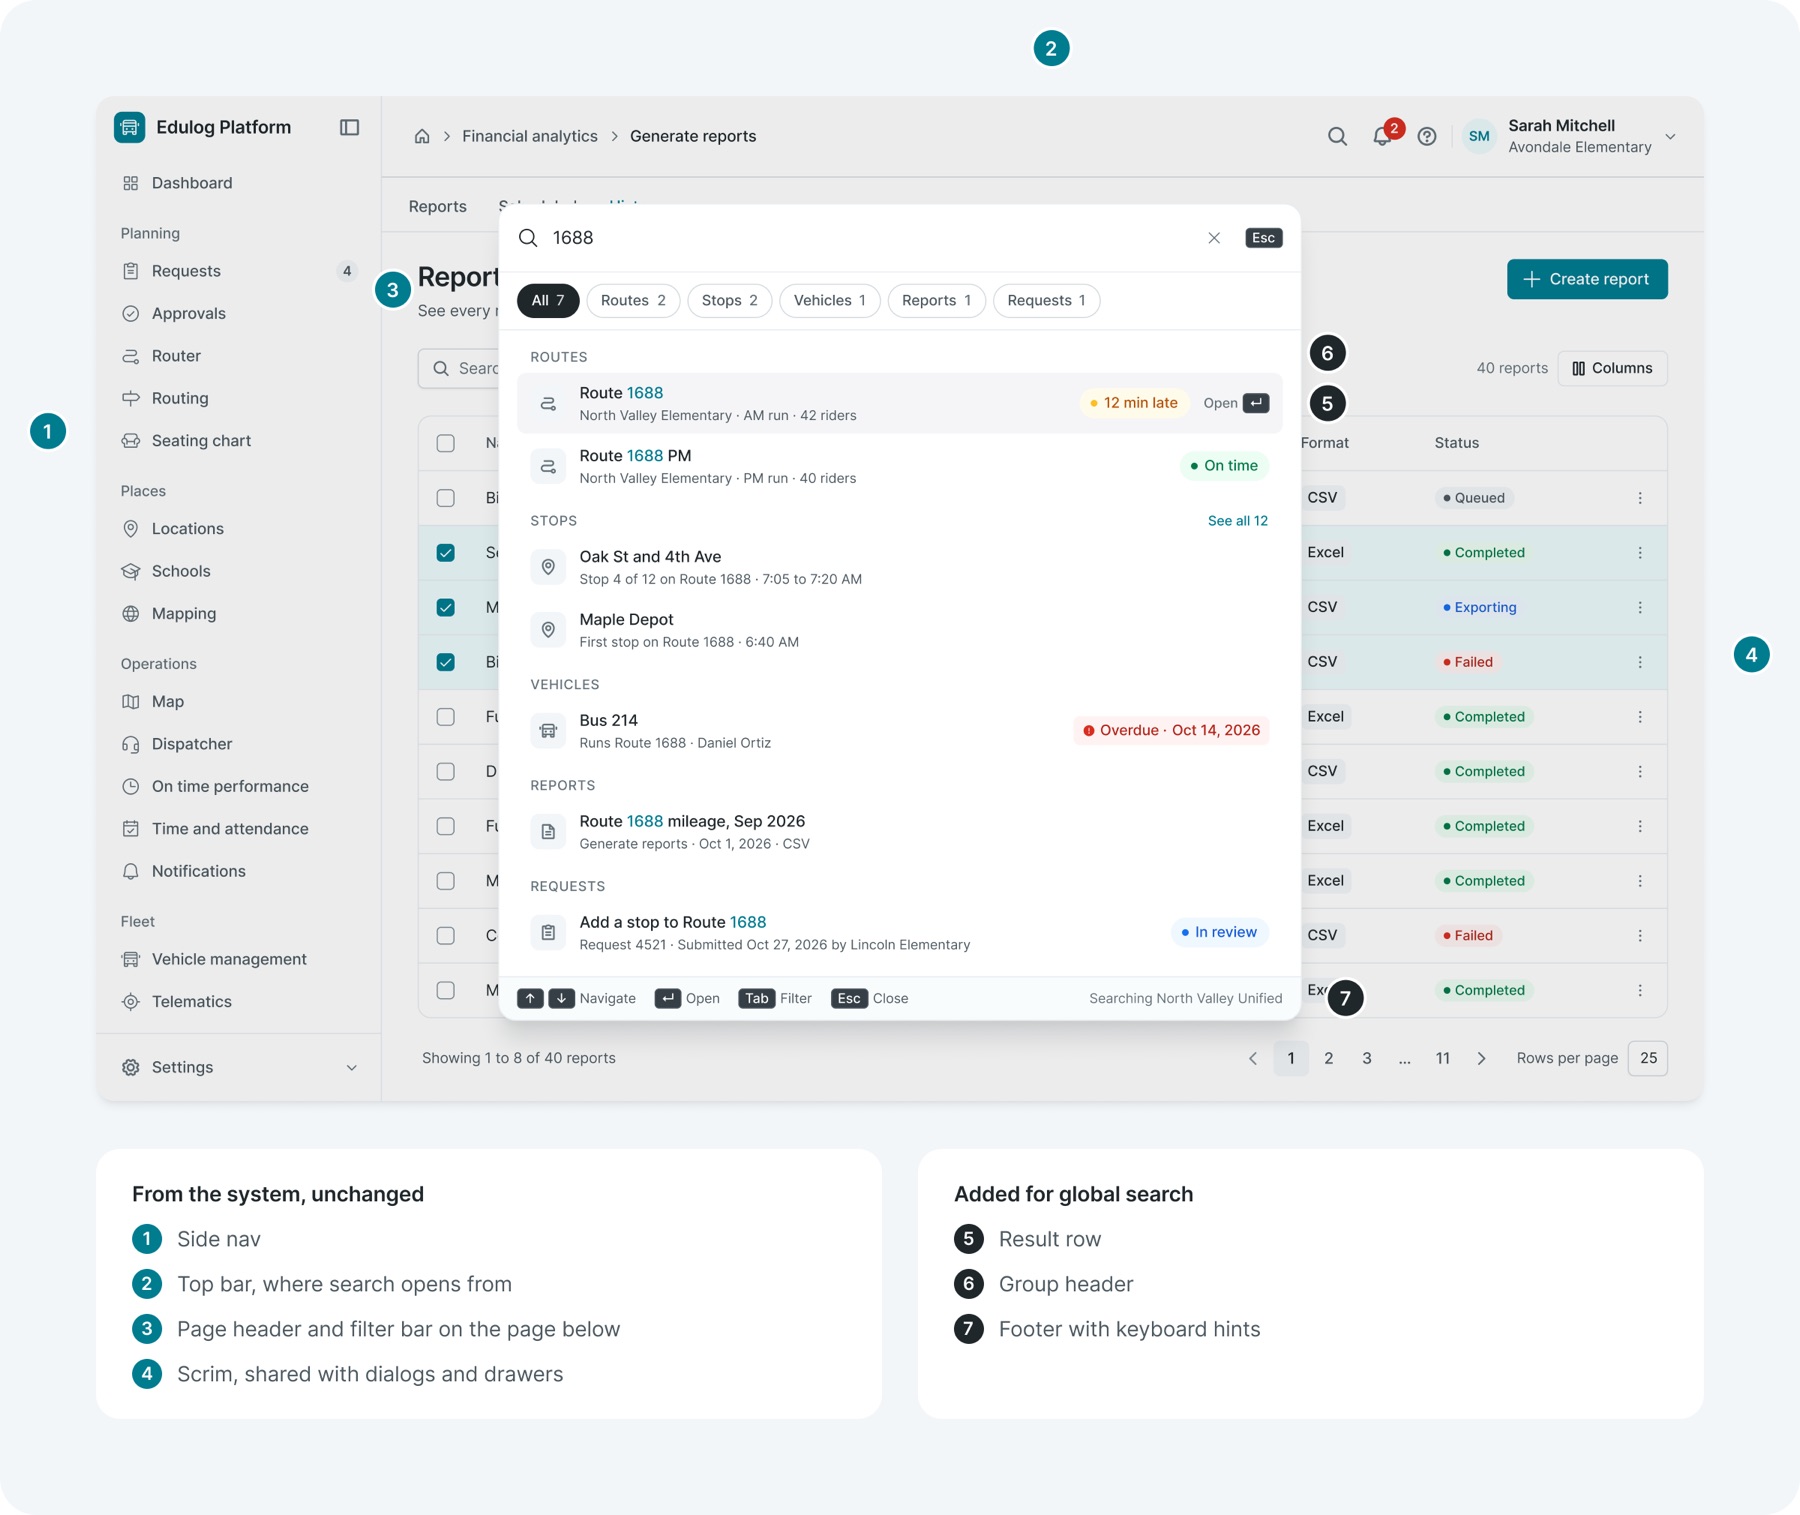
03Workflow builder
The newest and most different tool: a canvas that lives inside Settings. It reused the Settings nav, the floating drawer and every form field. It needed four new parts, all built from existing tokens: the workflow node, the step option, the step library and the canvas controls.
Reused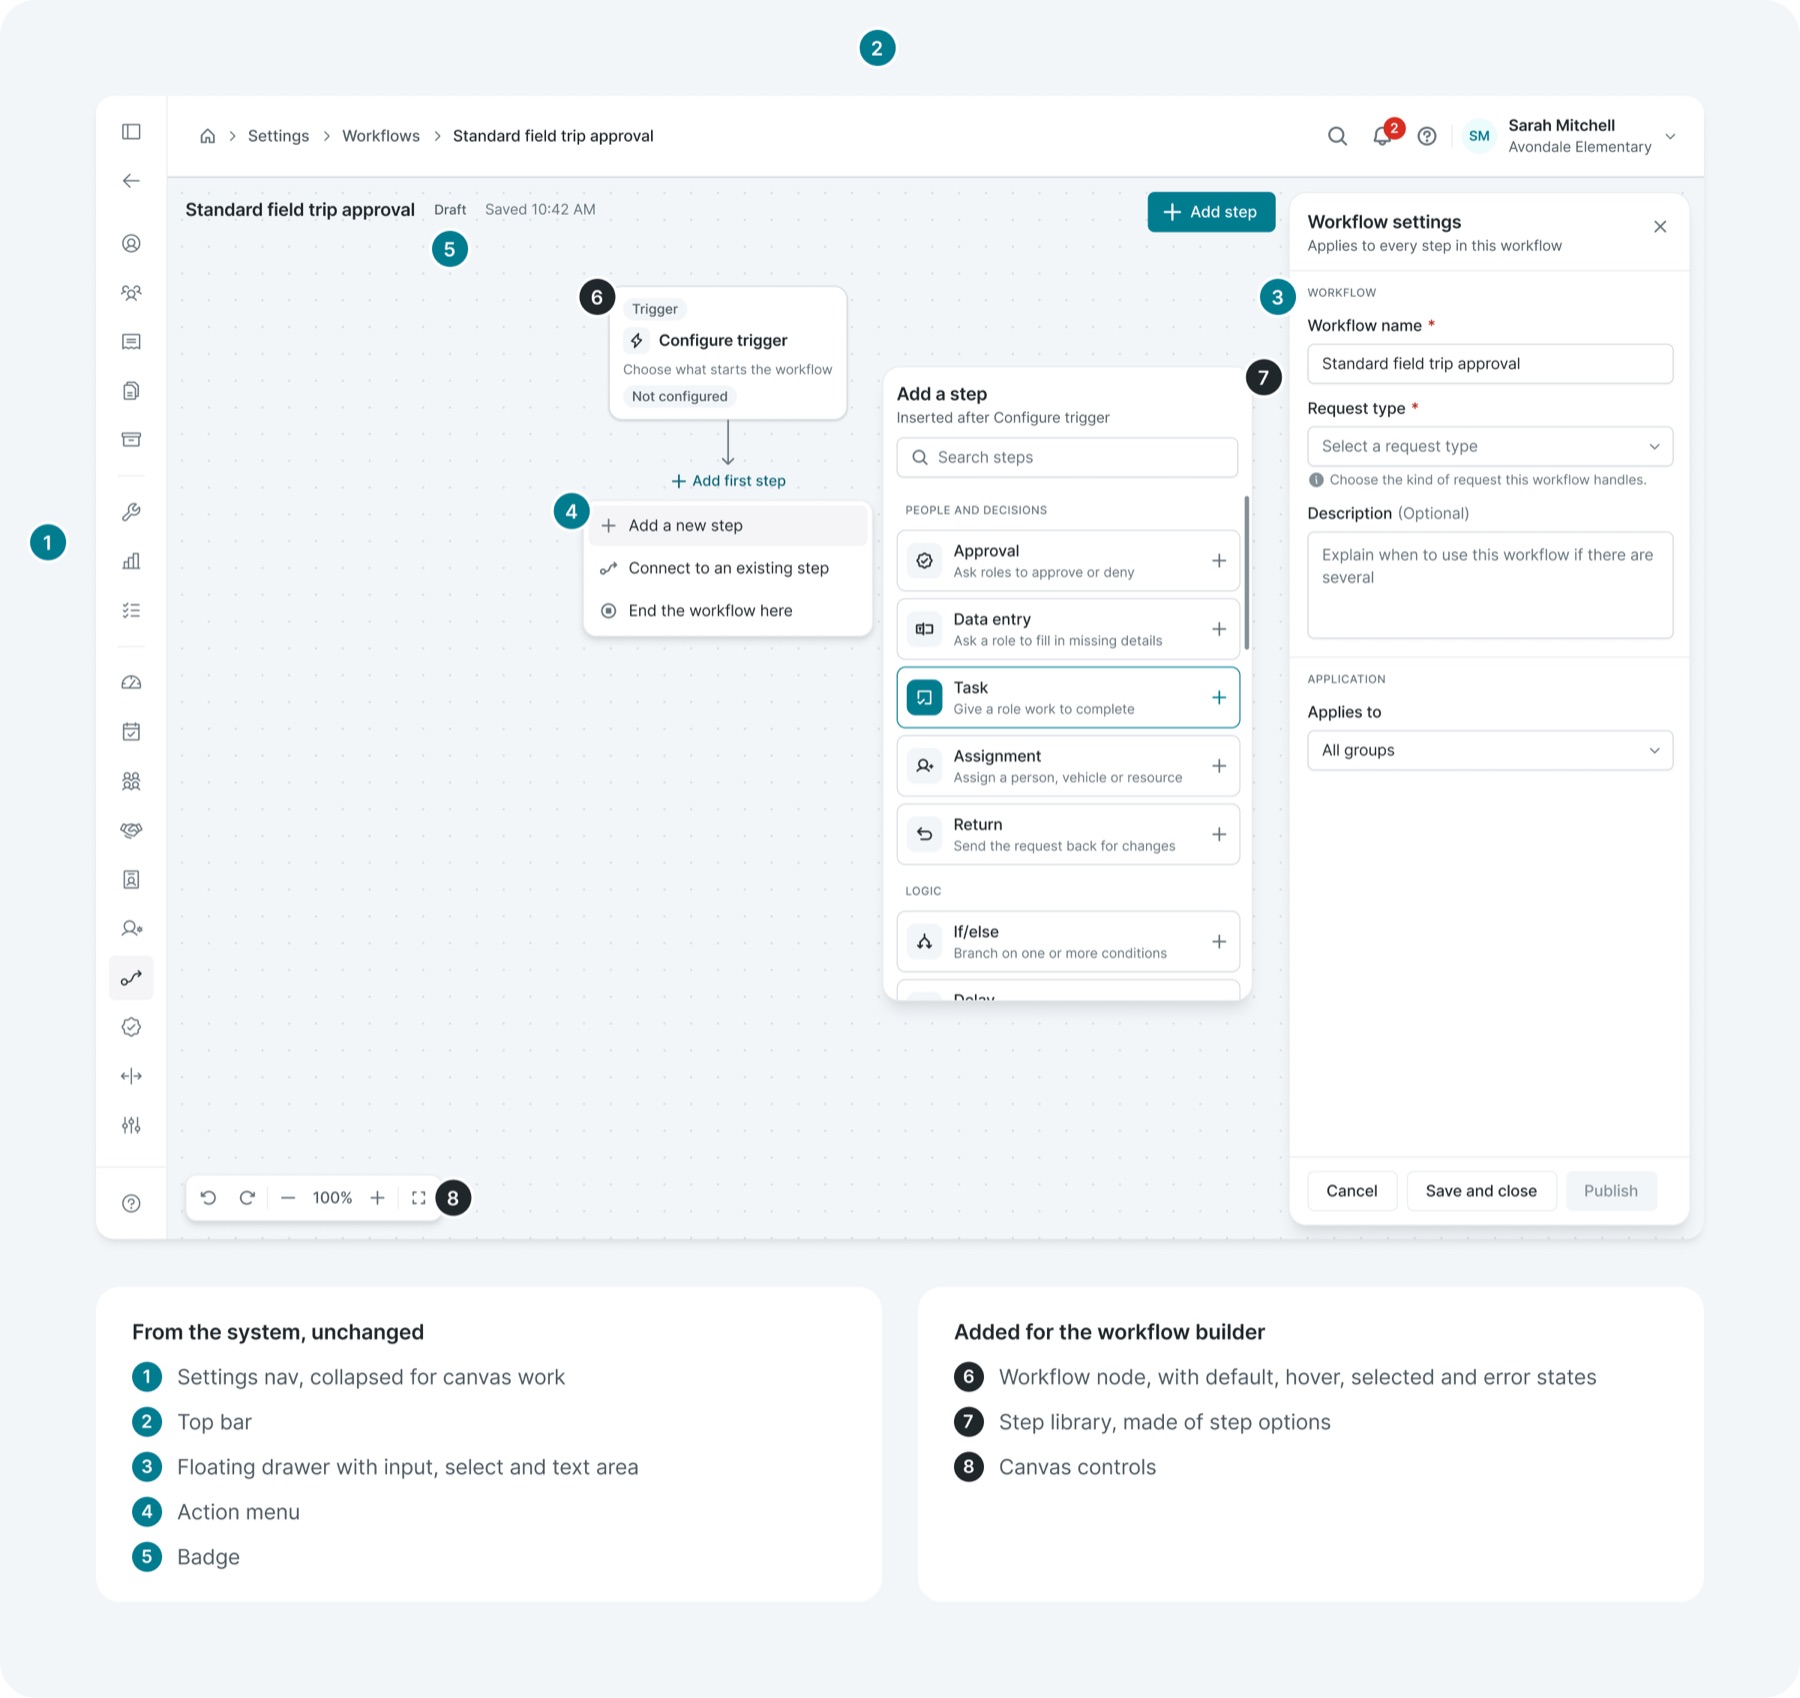
A note on "in use" — these tools were designed by the design team on top of the system. The library is the source for design work today. Engineering adoption in production is the next stage, covered in the reflection.
Documentation
Make the reasoning available to the next designer
A system that lives in one person's head stops at that person. Each component's documentation includes its introduction, specimen, guidelines and examples. Changelogs record what changed and when, page statuses communicate readiness, and archived versions preserve earlier decisions instead of deleting them.
01Four frames per component
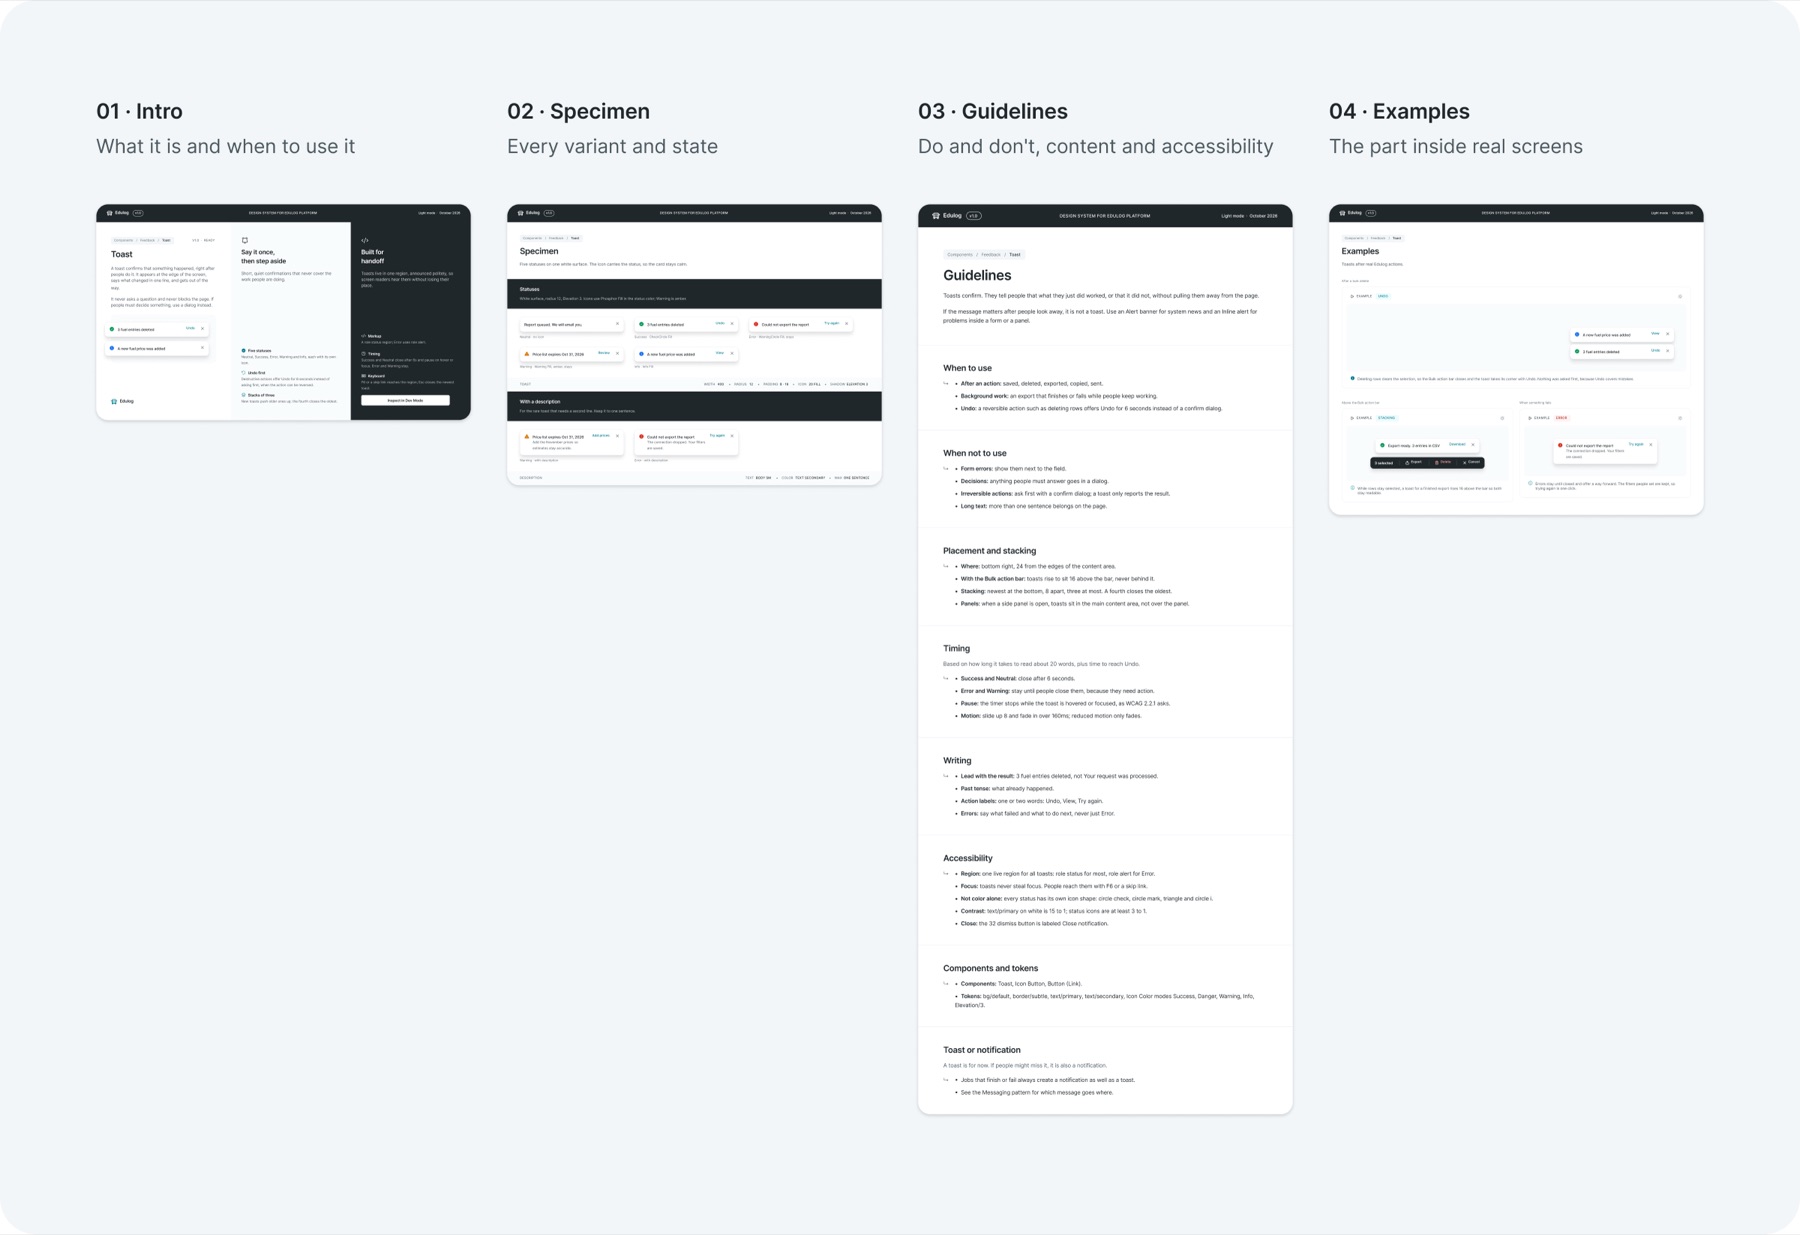
02Guidelines written for decisions, not decoration
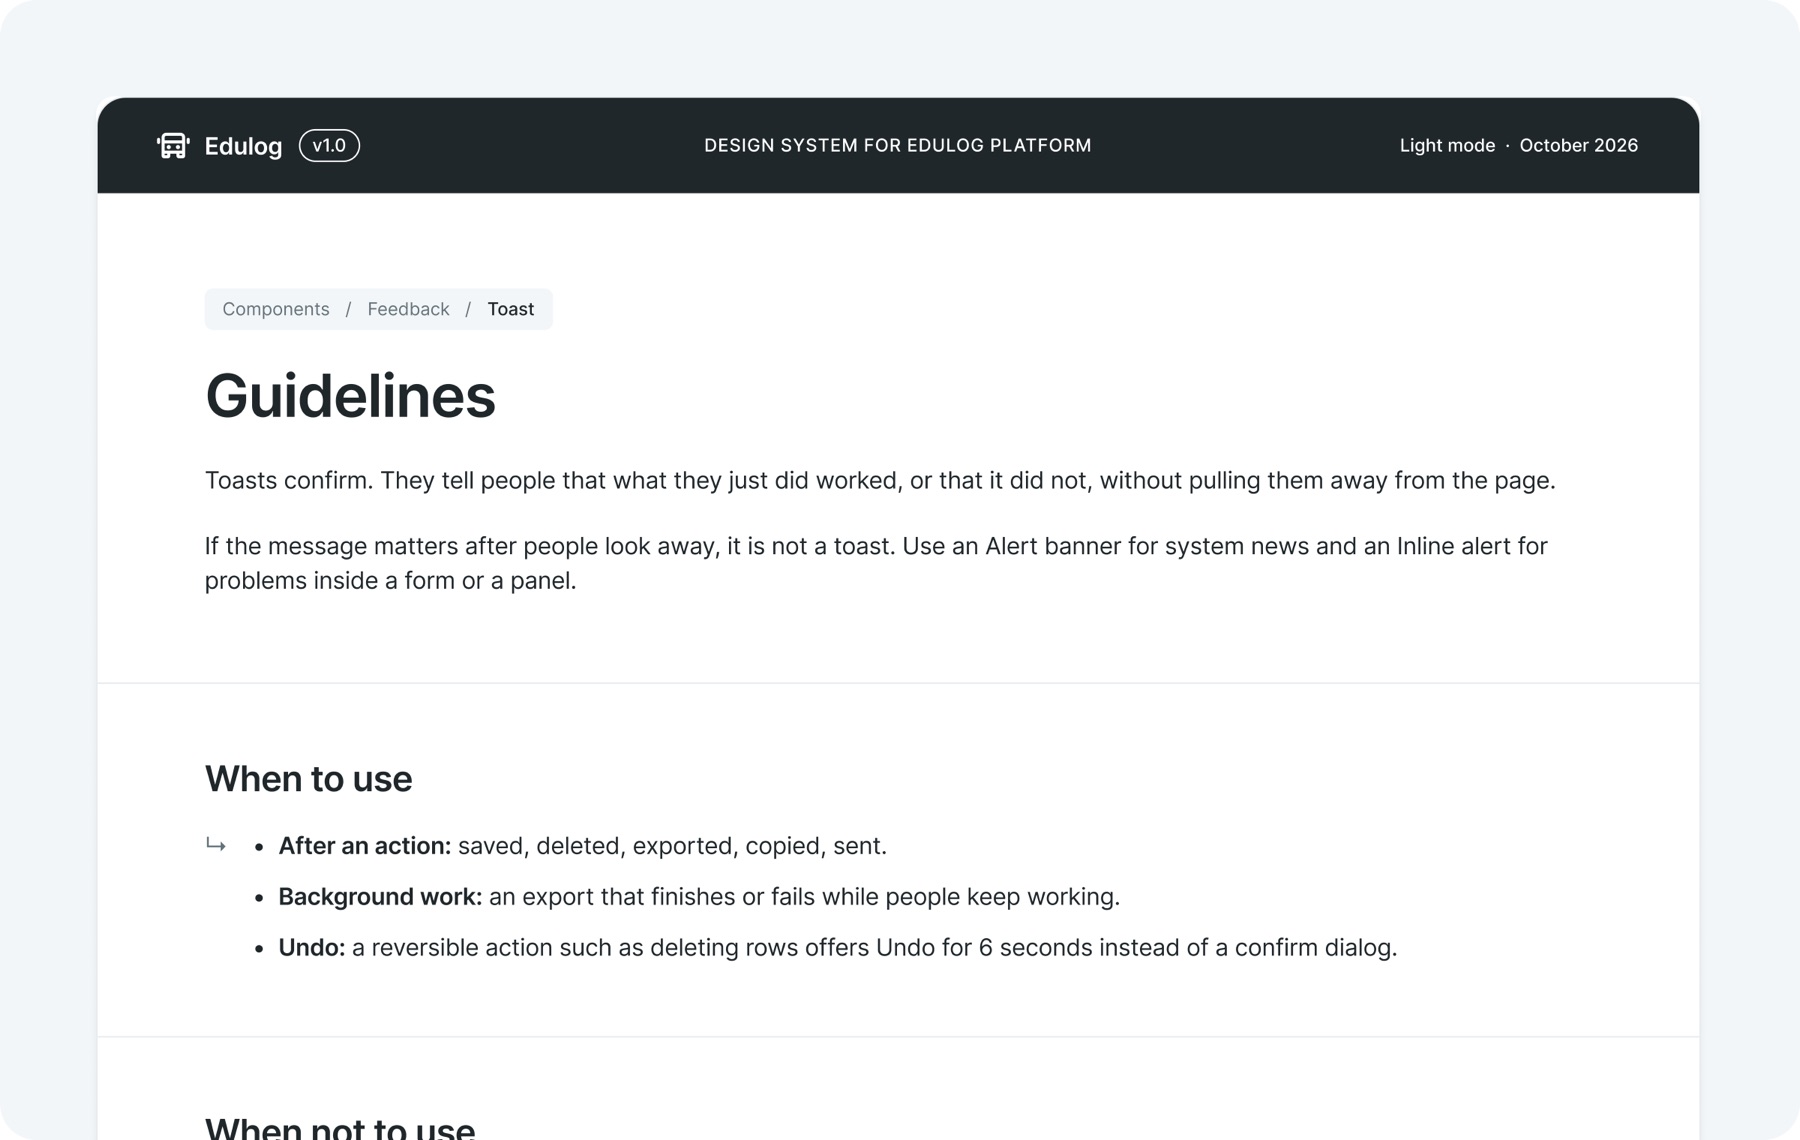
Guidelines answer the questions people actually ask in review: when to use the part, when not to, where it goes, how long it stays and what it should say.
03Changelog, statuses and archive
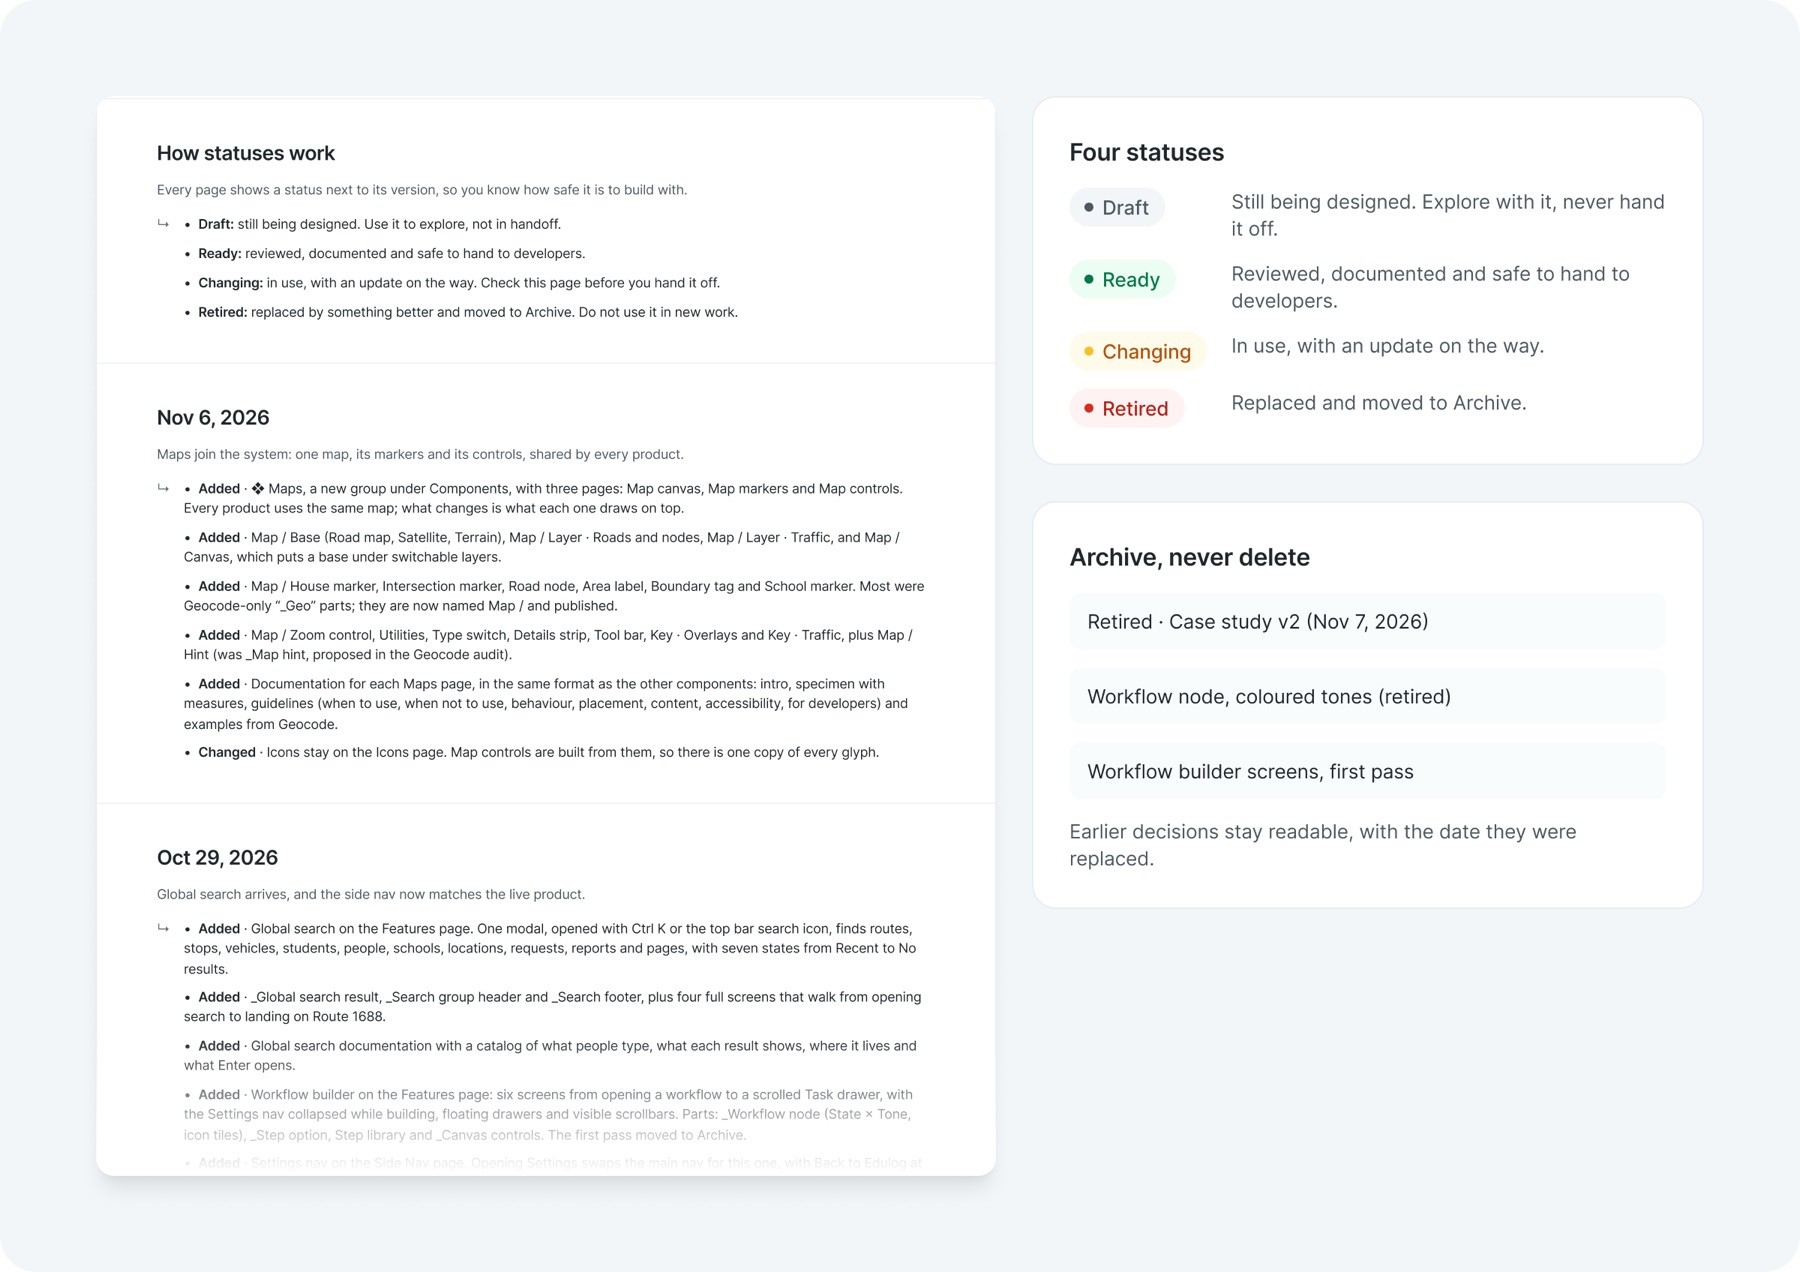
The changelog records what changed and when, in plain language. Every page carries one of four statuses, so nobody hands off something still being designed. Retired work moves to Archive with a date, never deleted, so the reasoning behind a past decision is still there to read.
- Still being designed. Explore with it, never hand it off.
- Reviewed, documented and safe to hand to developers.
- Earlier decisions stay readable, with the date they were replaced.
Reflection
The work established a shared foundation for designing across Edulog. Three very different tools were built on it without inventing their own conventions. The next challenge is extending that consistency into implementation and contribution, so the system can keep developing without relying on me in every review.
Starting with navigation. It made the fragmentation visible to everyone, and every later rule could point back to one principle: the structure should explain the work.
Router and Routing, and Map and Mapping, still sit next to each other in the side nav. The grouping is clearer, but the naming needs testing with planners and dispatchers before I would call it solved.
I used AI to audit the file at scale: renaming 330 layers from Athena to Edulog, checking every contrast pair and drafting documentation. Every change was reviewed by me, and every design decision stayed mine.
Bringing the tokens and components into code with engineering, a contribution process for other designers, and measuring task time with real users so impact is shown, not assumed.